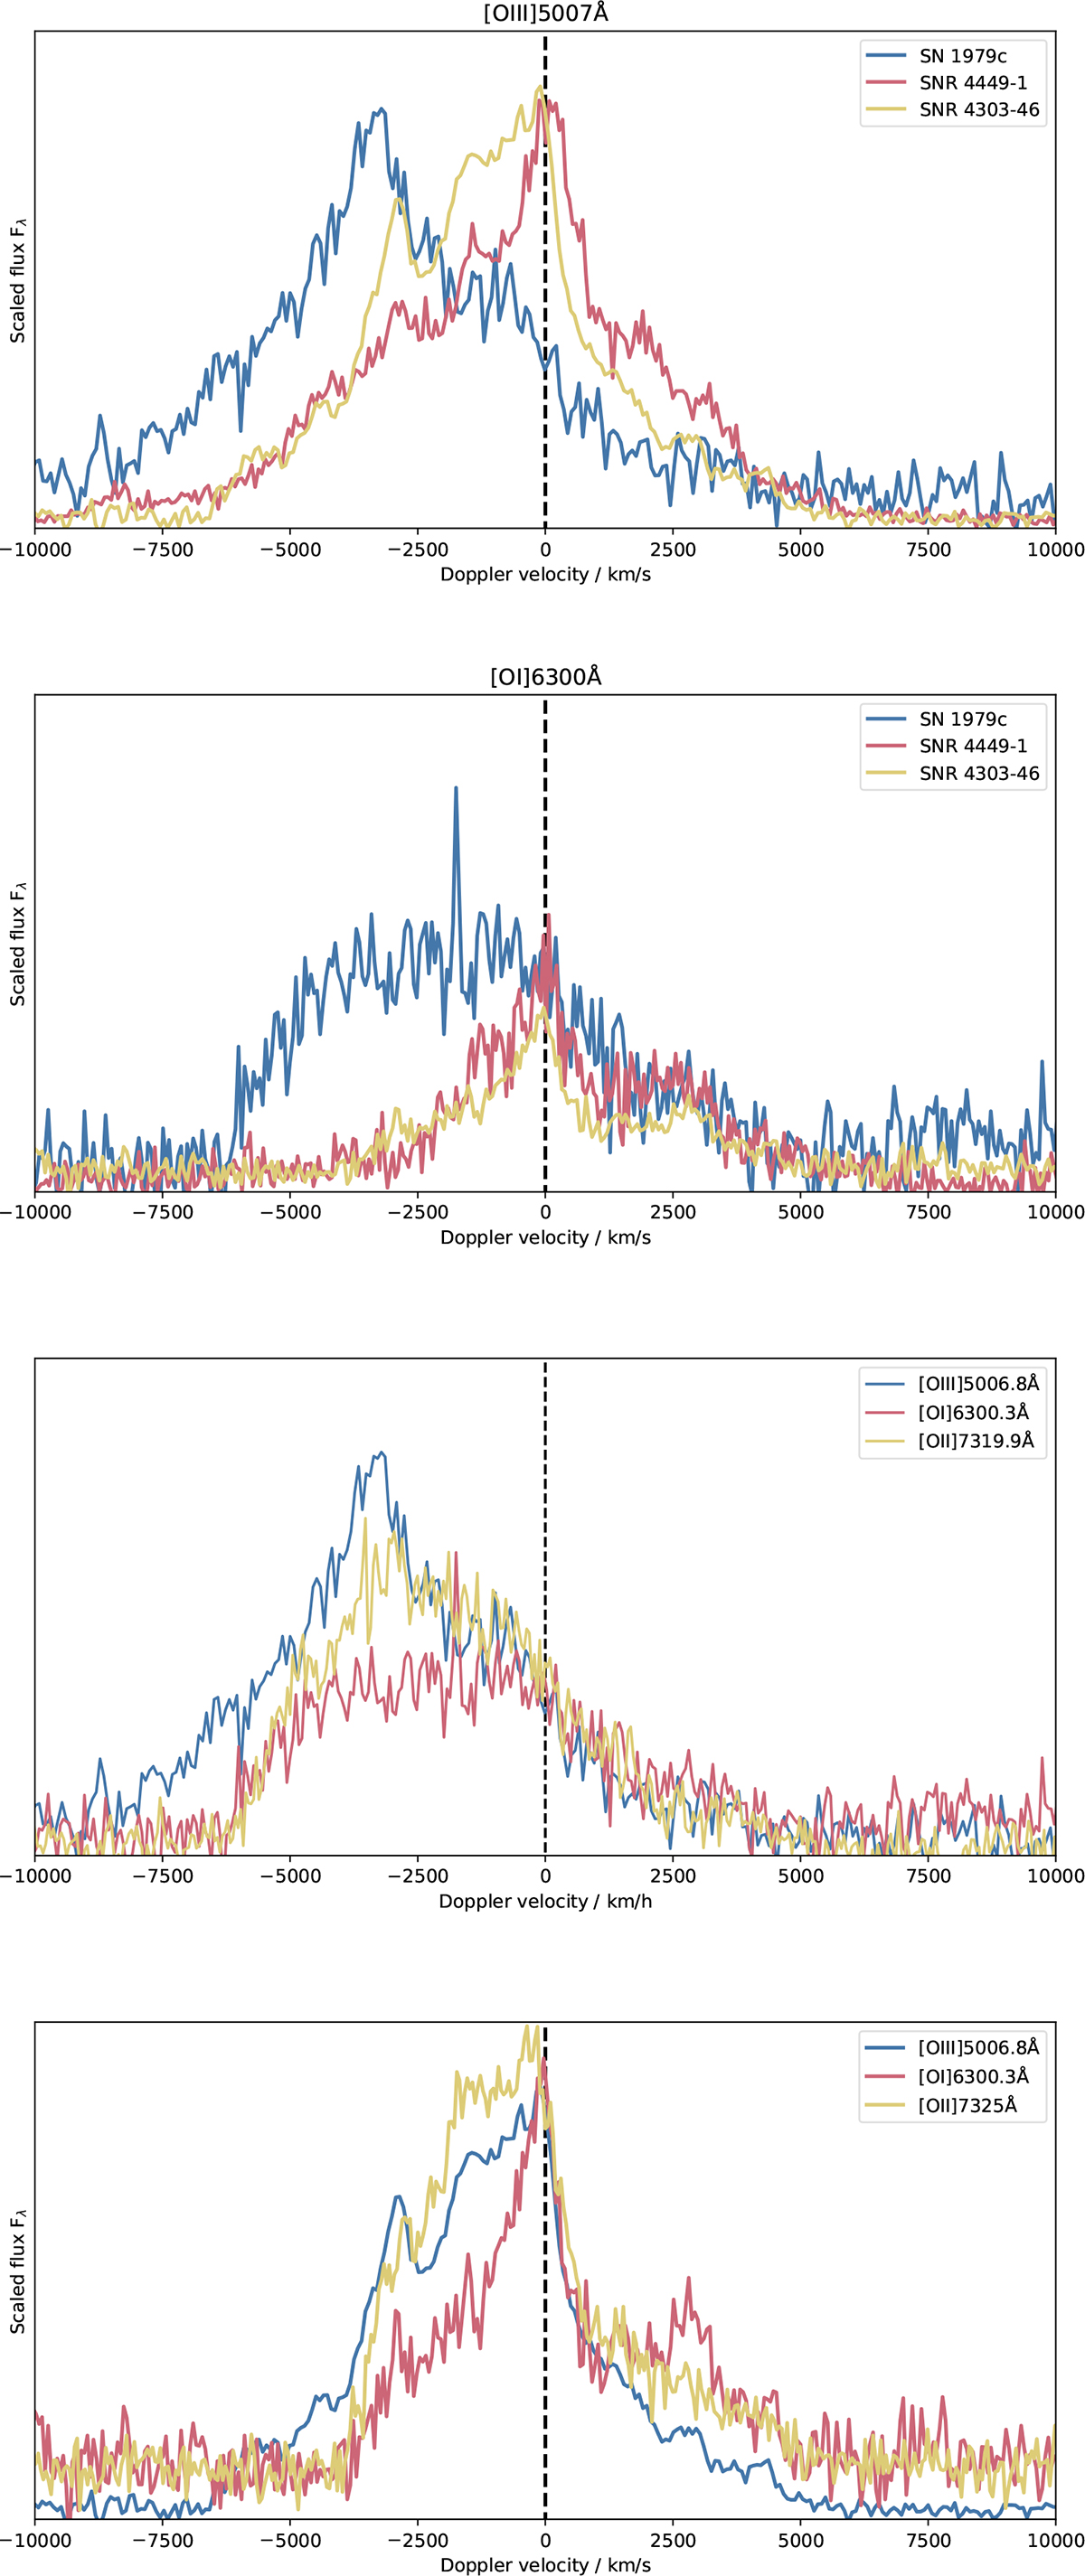
Fig. 9.
Download original image
[O III]λλ4959,5007 emission complex in velocity space centered around 5006.8 Å (top) and same for [O I]λλ6300,6364 centered around 6300 Å (second panel). The oxygen lines of SN1979C with the addition of [O II]λλ7320,7330 centered at 7320 Å (third panel) and the same lines for SNR 4303-5 (bottom panel). The spectra are normalized arbitrarily to have similar peak intensities. Corresponding figures to other O-rich SNRs are presented in Appendix D.
Current usage metrics show cumulative count of Article Views (full-text article views including HTML views, PDF and ePub downloads, according to the available data) and Abstracts Views on Vision4Press platform.
Data correspond to usage on the plateform after 2015. The current usage metrics is available 48-96 hours after online publication and is updated daily on week days.
Initial download of the metrics may take a while.