Open Access
Fig. 1
Download original image
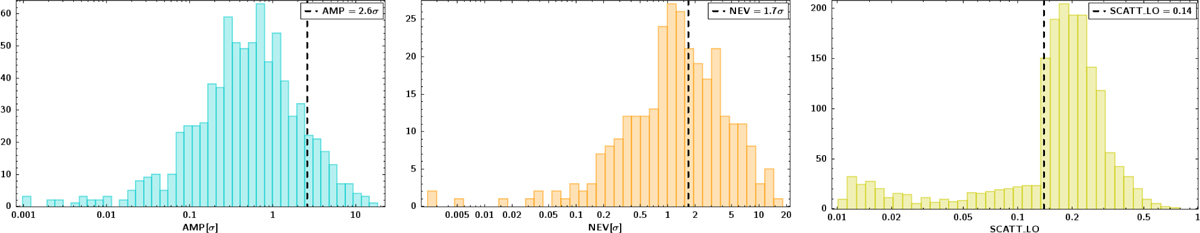
Histograms of the AMP, NEV, and SCATT_LO distributions in logarithmic scale for the sources released in the catalogue. Negative values are excluded. Vertical lines are thresholds for sources considered significantly variable. More details are given in Sect. 5.1.
Current usage metrics show cumulative count of Article Views (full-text article views including HTML views, PDF and ePub downloads, according to the available data) and Abstracts Views on Vision4Press platform.
Data correspond to usage on the plateform after 2015. The current usage metrics is available 48-96 hours after online publication and is updated daily on week days.
Initial download of the metrics may take a while.