Fig. 6
Download original image
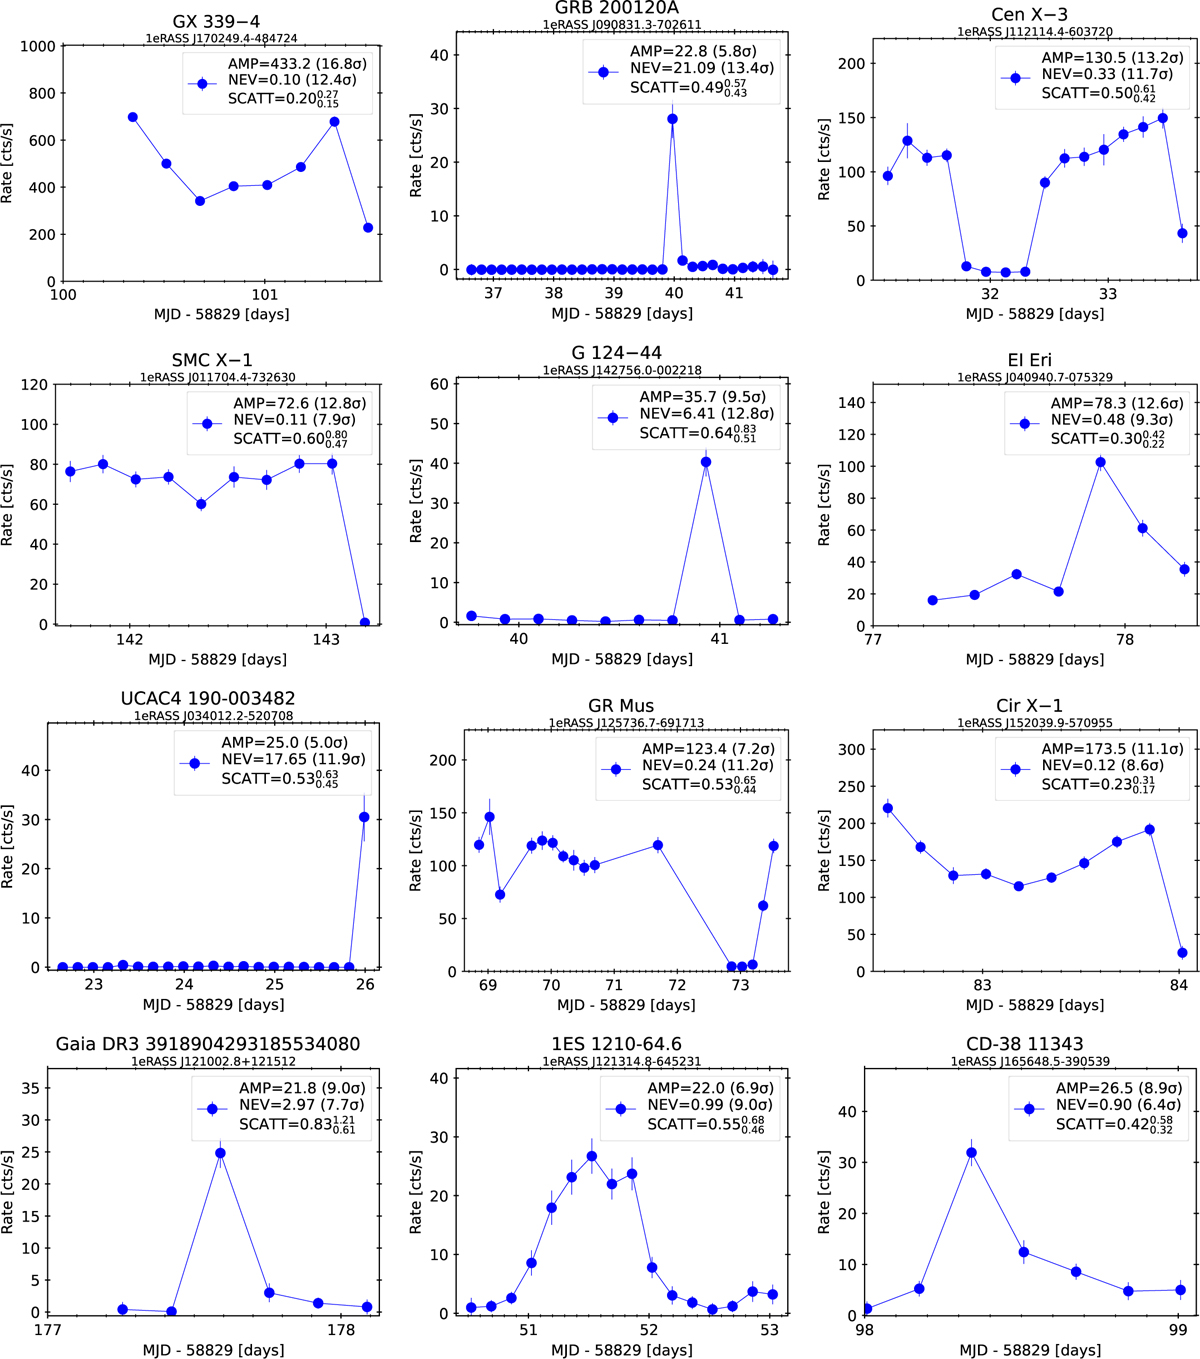
Light curves of the 12 most variable DR1 sources. The bin size is one eroday, and the energy range is (0.6–2.3) keV. For the normalised excess variance and the maximum amplitude variability, the values and significance (NEVσ, AMPσ) in units of σ are indicated along the top of each panel. As in Table 1, the objects are ordered by significance (NEVσ or AMPσ, whichever is larger) from top left to bottom right. The Bayesian excess variance is also indicated (SCATT), with the 10% (bottom, SCATT_LO) and 90% quantiles (top). The IAU name is given at the top of each figure. The x-axis shows the time in MJD units normalised to the launch of eROSITA on 2019-12-11, 21:30 (GMD) in days. The large variability of GX 339–4 is interpreted as due to pile-up (cf. Sect. 5.5.2.).
Current usage metrics show cumulative count of Article Views (full-text article views including HTML views, PDF and ePub downloads, according to the available data) and Abstracts Views on Vision4Press platform.
Data correspond to usage on the plateform after 2015. The current usage metrics is available 48-96 hours after online publication and is updated daily on week days.
Initial download of the metrics may take a while.