Fig. 7
Download original image
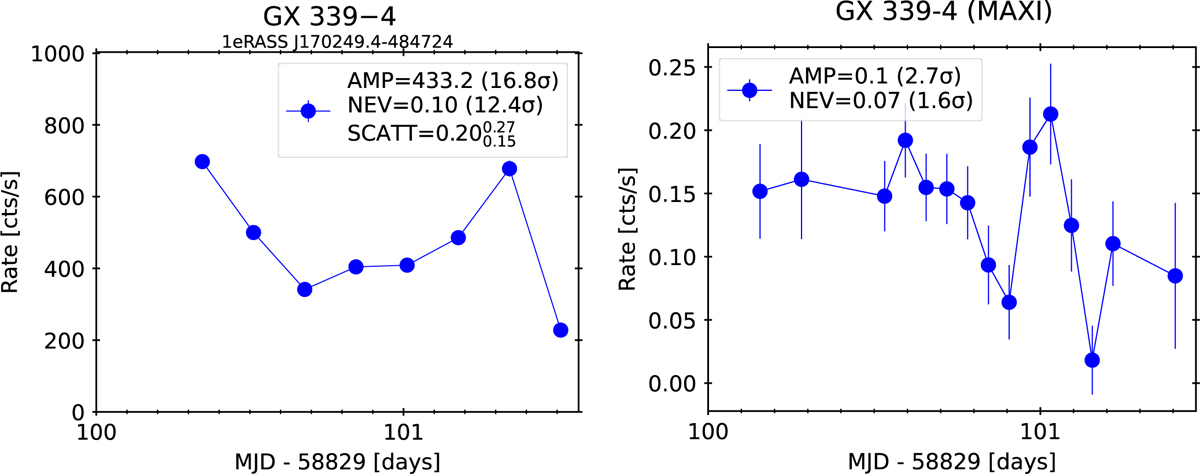
Left panel: eROSITA light curve of GX 339–4 in the soft (0.6–2.3 keV) band. Right panel: MAXI light curve in the (2–4) keV band. The AMP and NEV values obtained from the MAXI light curve are below three σ. The eROSITA AMP and NEV values are 16.77, 12.42 σ (soft 0.6–2.3 keV) and 3.47, 3.81 σ (hard 2.3–5 keV), respectively. The eROSITA soft and hard band DR1 light curves are strongly affected by pile-up (cf. Sect. 5.5.2).
Current usage metrics show cumulative count of Article Views (full-text article views including HTML views, PDF and ePub downloads, according to the available data) and Abstracts Views on Vision4Press platform.
Data correspond to usage on the plateform after 2015. The current usage metrics is available 48-96 hours after online publication and is updated daily on week days.
Initial download of the metrics may take a while.