Fig. 18.
Download original image
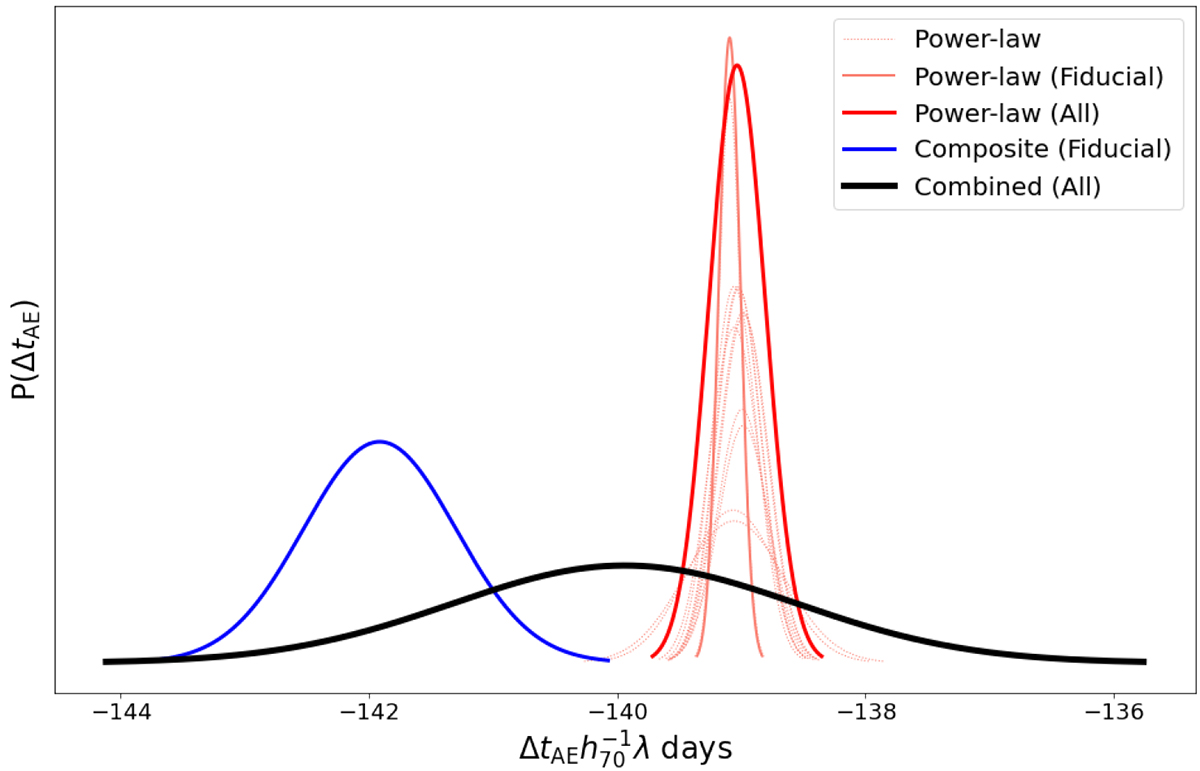
Probability density of predicted time-delay for image pair AE of the sextuply lensed quasar. Shown are the delay predictions for the various power-law models (dotted salmon colored) according to their corresponding BIC weight. Also plotted are the delay predictions for the fiducial power-law model (solid red) and the fiducial composite model (solid blue). The thick black solid line represents the combined probability density of all BIC weighted models. The factor λ represents the presently unknown external convergence and the MST factor, to be determined with ancillary data.
Current usage metrics show cumulative count of Article Views (full-text article views including HTML views, PDF and ePub downloads, according to the available data) and Abstracts Views on Vision4Press platform.
Data correspond to usage on the plateform after 2015. The current usage metrics is available 48-96 hours after online publication and is updated daily on week days.
Initial download of the metrics may take a while.