Fig. 4.
Download original image
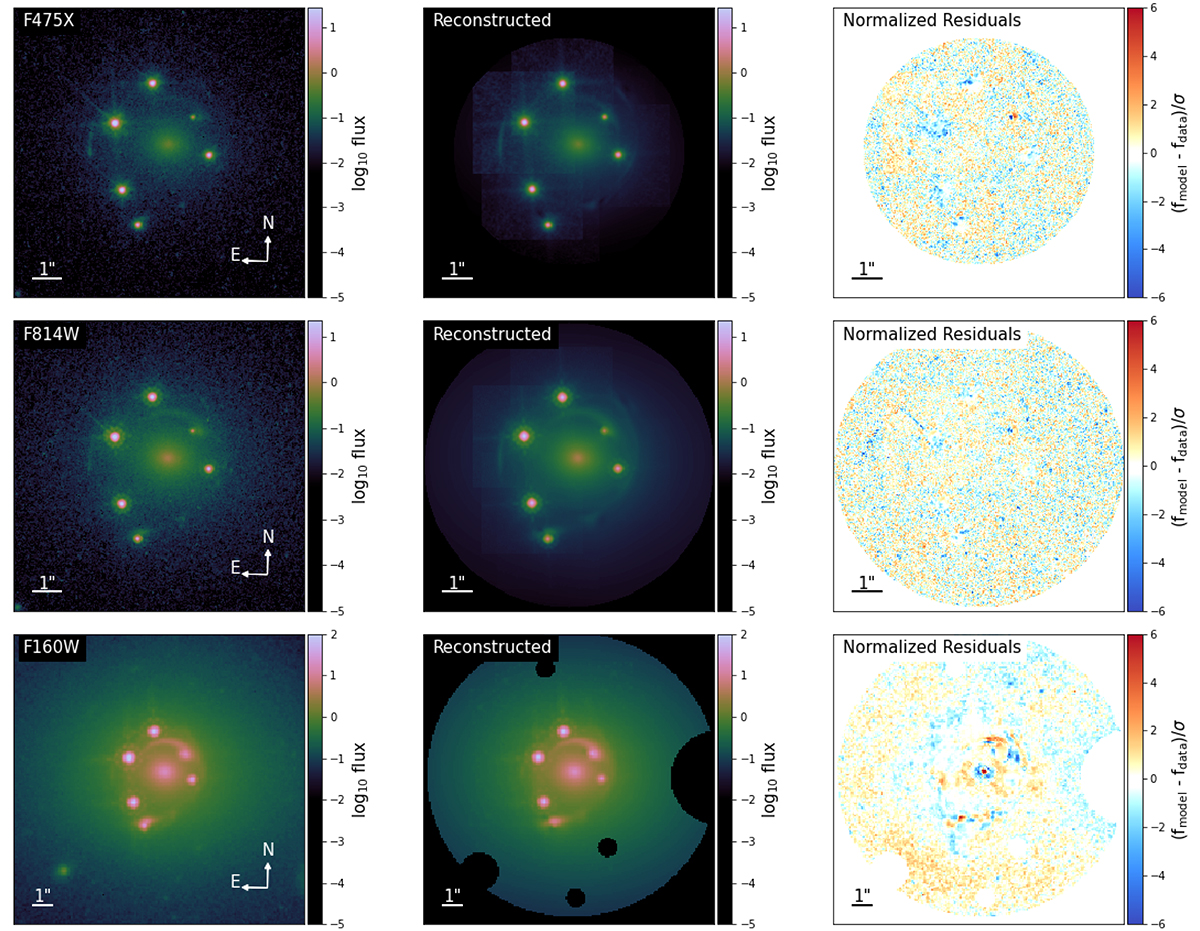
Reconstructed power-law model for J1721+8842. The first column (left) shows the observations in each band, sorted by wavelength from short to long. The second column (center) displays the reconstructed model for each filter, and in the third column (right) are the normalized residuals between our model and the observed data.
Current usage metrics show cumulative count of Article Views (full-text article views including HTML views, PDF and ePub downloads, according to the available data) and Abstracts Views on Vision4Press platform.
Data correspond to usage on the plateform after 2015. The current usage metrics is available 48-96 hours after online publication and is updated daily on week days.
Initial download of the metrics may take a while.