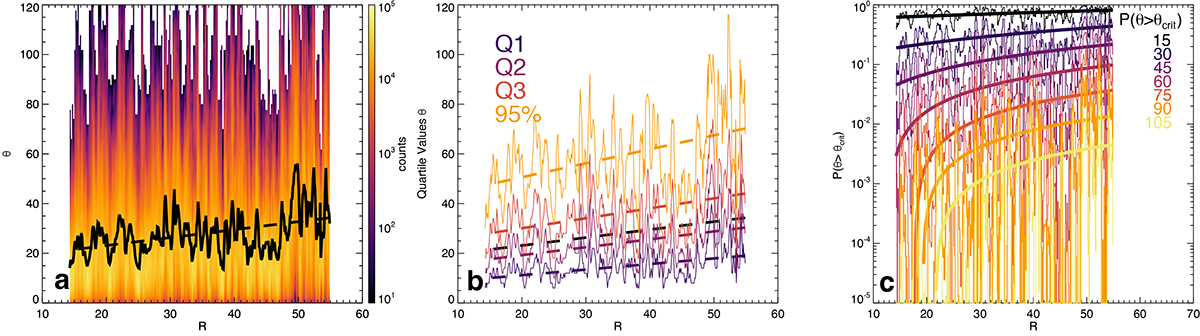
Fig. 4.
Download original image
a) Distribution of θ, the angle between the magnetic field and the mean field direction as a function of the solar radius. The black line shows the mean θ at each radius, with a linear least square fit line shown in black. b) Quartiles and 95th percentile of distribution shown in panel (a). Least square fit lines are shown for each percentile. c) Probability of θ > θcrit for a range of θcrit between 15 and 105 degrees. Larger θcrit are shown in lighter colors. Linear least square fit trend lines are plotted for each θcrit.
Current usage metrics show cumulative count of Article Views (full-text article views including HTML views, PDF and ePub downloads, according to the available data) and Abstracts Views on Vision4Press platform.
Data correspond to usage on the plateform after 2015. The current usage metrics is available 48-96 hours after online publication and is updated daily on week days.
Initial download of the metrics may take a while.