Fig. 2.
Download original image
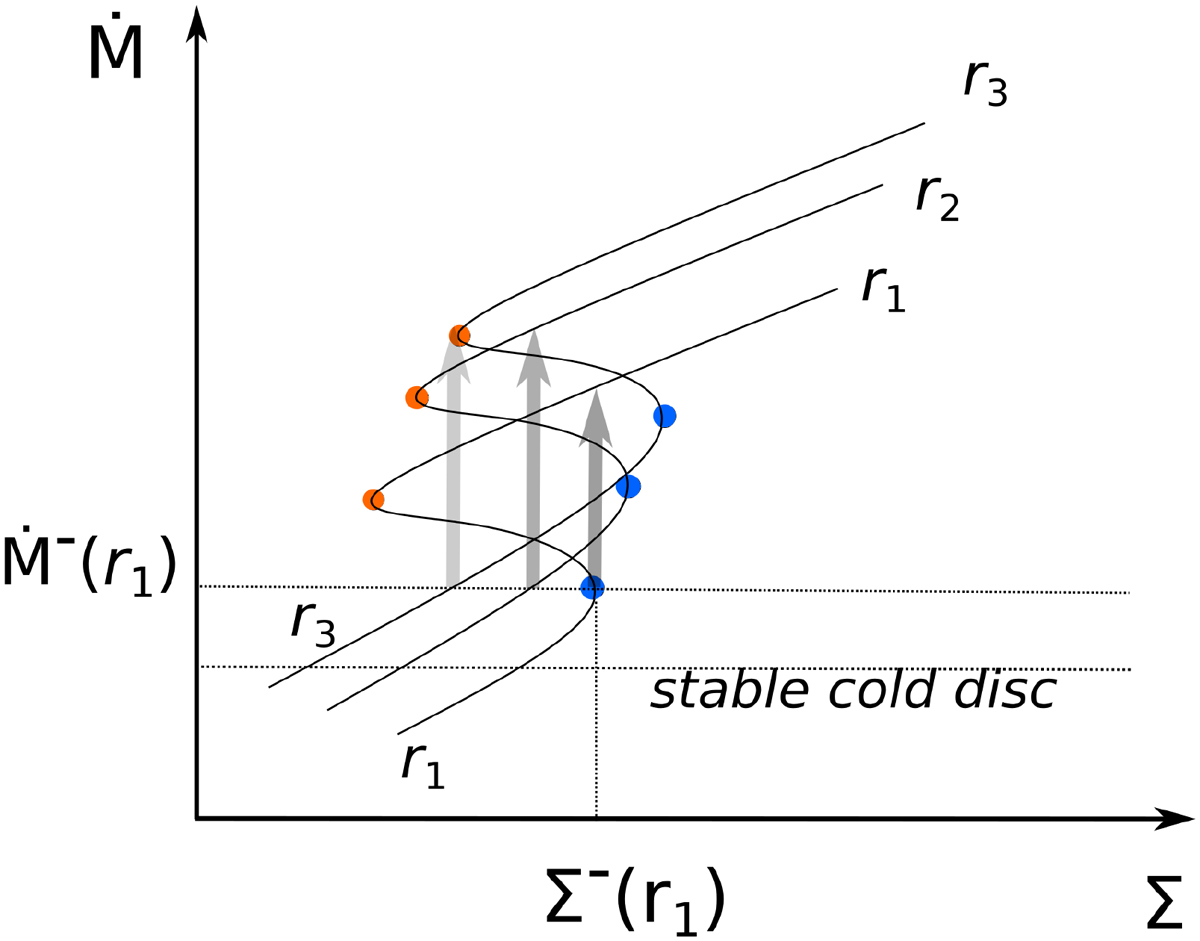
S-curves at different radii r1 < r2 < r3, shown schematically for ionisation instability. When the accretion rate is very low, the whole disc is stable and cold (the bottom line on the plot). If the surface density exceeds the critical value at the innermost radius r1, a heating wave, indicated by arrows, starts outwards, potentially reaching r3.
Current usage metrics show cumulative count of Article Views (full-text article views including HTML views, PDF and ePub downloads, according to the available data) and Abstracts Views on Vision4Press platform.
Data correspond to usage on the plateform after 2015. The current usage metrics is available 48-96 hours after online publication and is updated daily on week days.
Initial download of the metrics may take a while.