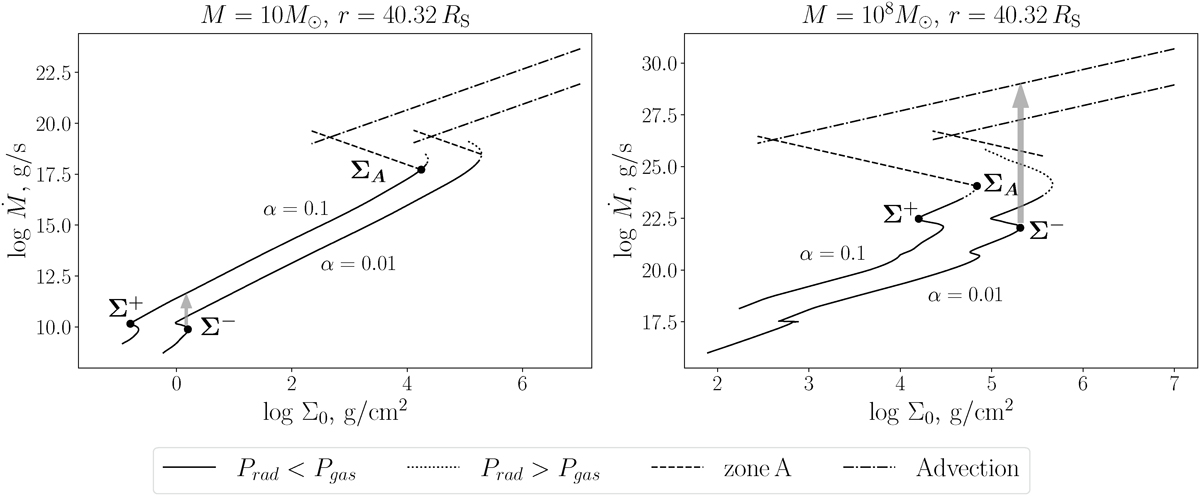
Fig. 3.
Download original image
Equilibrium curves for discs around stellar-mass BH (left panel) and SMBH (right panel). In each panel, the ξ-curves are constructed for two values of the turbulent parameter α: 0.1 and 0.01. The solid lines are calculated by ALPHADISC and their upper dotted tails correspond to Prad > Pgas. Analytic relations in the radiation-pressure regime (A zone, dashed, ∝Σ−1) and the advective regime (dash-dotted, ∝Σ) are calculated using Eqs. (B.5) and (B.4), respectively. The dots mark critical points for the geometrically thin states: the minimum and the maximum surface density, Σ+ and ΣA, in the ionised state and the maximum surface density Σ− in the recombined state The arrows schematically show the direction of ring heating due to ionisation instability. At the same time, α increases.
Current usage metrics show cumulative count of Article Views (full-text article views including HTML views, PDF and ePub downloads, according to the available data) and Abstracts Views on Vision4Press platform.
Data correspond to usage on the plateform after 2015. The current usage metrics is available 48-96 hours after online publication and is updated daily on week days.
Initial download of the metrics may take a while.