Fig. 4.
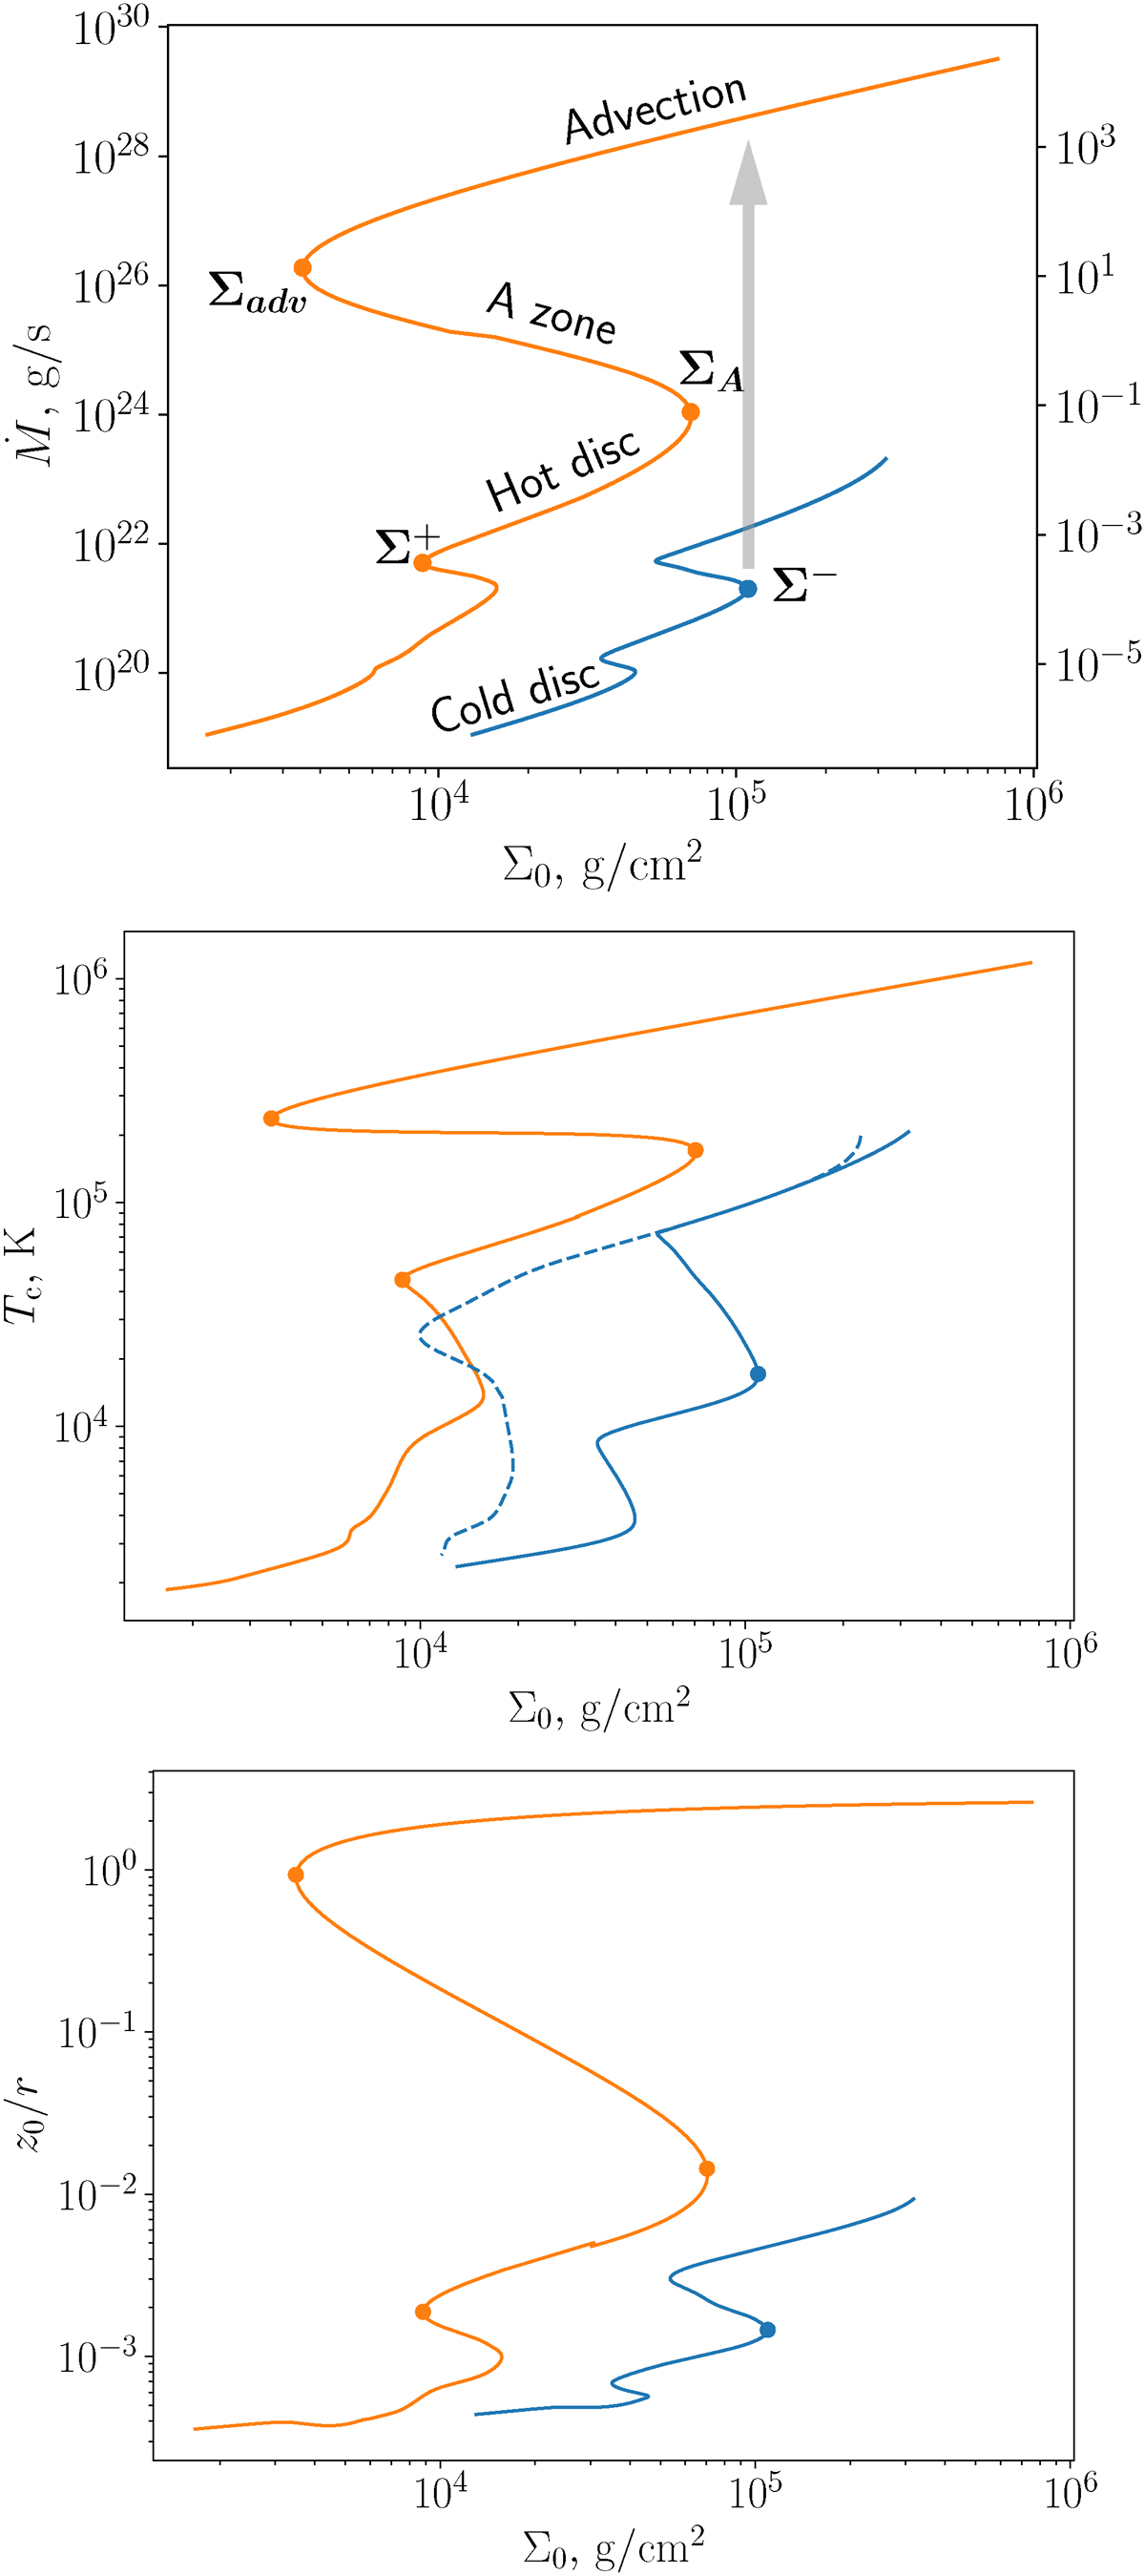
Download original image
S-curves for 107 M⊙ at r = 100 RS for two values of turbulent parameter αcold = 0.01 (blue) and αhot = 0.1 (orange). The branches ‘A-zone’ and ‘Advection’ were calculated using the code from Lipunova (1999). The accretion rate in absolute units shown on the left axis and in the Eddington rates (1), on the right (upper panel). Temperature Tc in the symmetry plane (middle panel). The dashed line shows the S-curve for αcold without convection. Relative semi-thickness z/r (bottom panel).
Current usage metrics show cumulative count of Article Views (full-text article views including HTML views, PDF and ePub downloads, according to the available data) and Abstracts Views on Vision4Press platform.
Data correspond to usage on the plateform after 2015. The current usage metrics is available 48-96 hours after online publication and is updated daily on week days.
Initial download of the metrics may take a while.