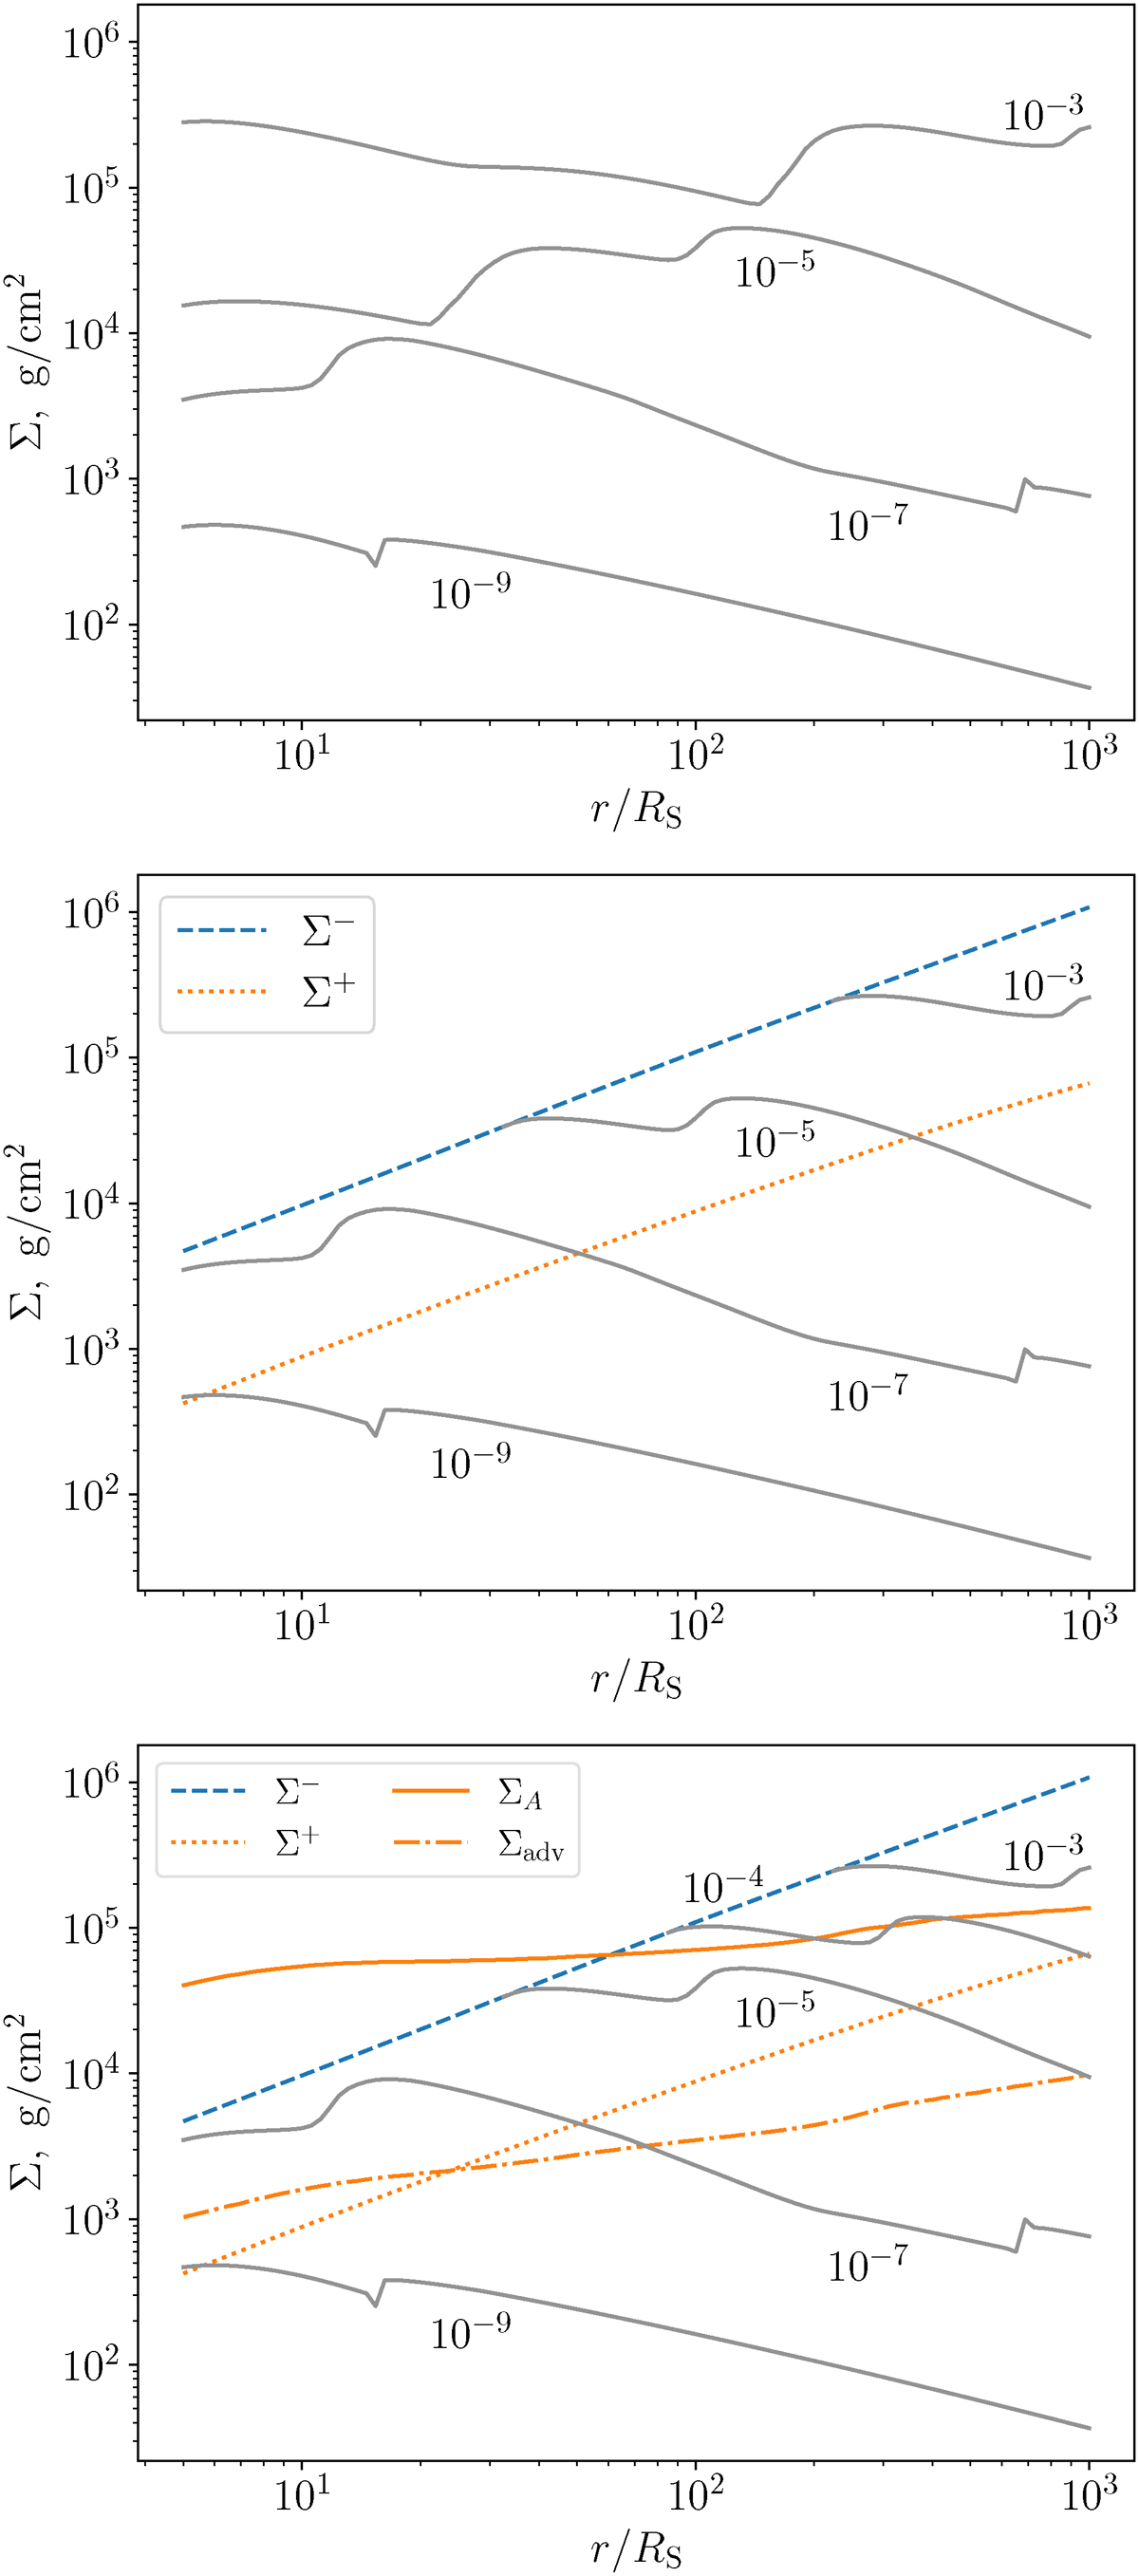
Fig. 6.
Download original image
Quasi-stationary surface density Σstat(r) for M = 107 M⊙ and α = αcold at several values of Ṁ, indicated in the graphs in units of ṀEdd (upper panel). Radial distributions of the critical points Σ+ for αhot and Σ− for αcold together with the stationary distributions (middle panel). The latter are shown only for Σstat < Σ−. Superimposed are the radial dependencies of the critical points ΣA and Σadv for αhot (bottom panel). In all panels, αcold = 0.01 (blue) and αhot = 0.1 (orange). The curves are plotted starting from 5RS.
Current usage metrics show cumulative count of Article Views (full-text article views including HTML views, PDF and ePub downloads, according to the available data) and Abstracts Views on Vision4Press platform.
Data correspond to usage on the plateform after 2015. The current usage metrics is available 48-96 hours after online publication and is updated daily on week days.
Initial download of the metrics may take a while.