Fig. 8.
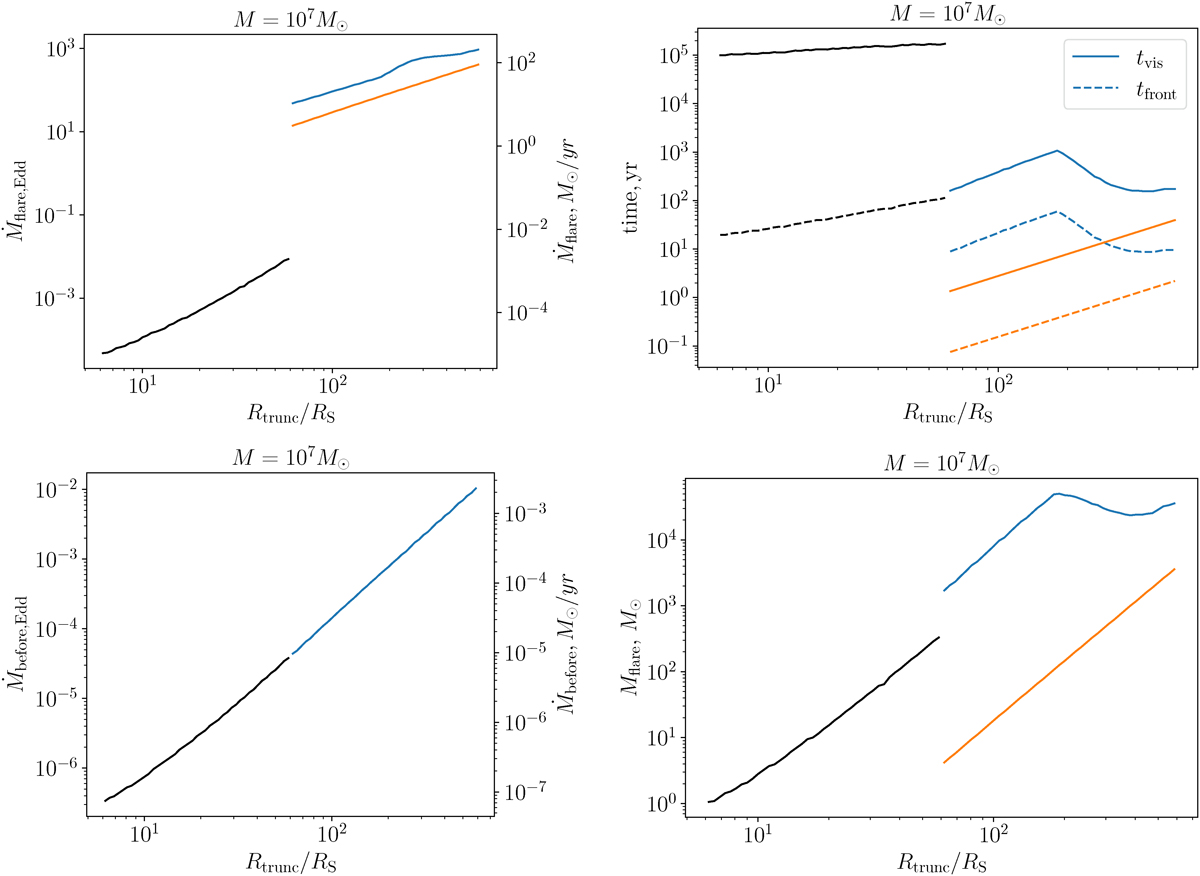
Download original image
Outburst properties for normal (black) and giant flares (blue and orange) vs. inner truncation radius of quiescent geometrically thin disc. Peak accretion rate (13) (upper left); Characteristic times, calculated using (11) for the flare evolution before the peak and (5) for the characteristic flare duration (upper right); Inner disc accretion rate before the flare (bottom left); Mass involved in a flare (bottom right). The blue curves show the upper limit, obtained if the disc is heated to the radius Rout,max. The orange curves represent the lower limit following assumption Rout = Rtrunc + z0 (see Sect. 4).
Current usage metrics show cumulative count of Article Views (full-text article views including HTML views, PDF and ePub downloads, according to the available data) and Abstracts Views on Vision4Press platform.
Data correspond to usage on the plateform after 2015. The current usage metrics is available 48-96 hours after online publication and is updated daily on week days.
Initial download of the metrics may take a while.