Fig. 6
Download original image
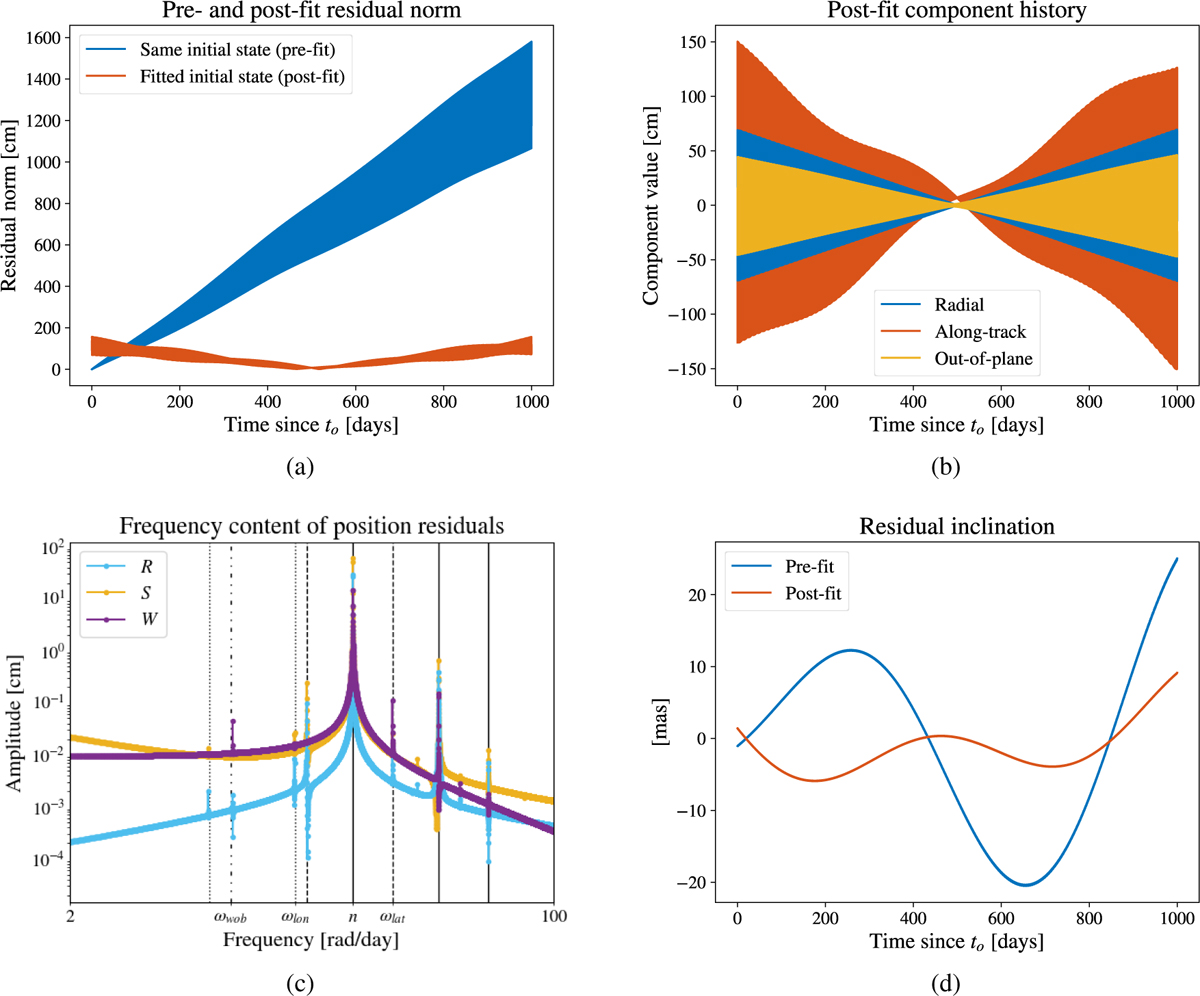
Residuals of a 1000-day estimation of initial state. A coupled model was used for observations and an uncoupled model for estimation. Panel a: differences between the coupled and uncoupled trajectories when the same initial state is used and when the best-fit estimated initial state is used for the uncoupled model. Panel b: time history of the RSW components of residuals. Panel c: frequency content of residual components. Vertical lines indicate (integer multiples/divisors of) the mean motion (solid) and the three normal modes: longitudinal (dotted), latitudinal (dashed), and wobble (dash-dot-dot). Panel d: differences in inclination between observed and estimated trajectories.
Current usage metrics show cumulative count of Article Views (full-text article views including HTML views, PDF and ePub downloads, according to the available data) and Abstracts Views on Vision4Press platform.
Data correspond to usage on the plateform after 2015. The current usage metrics is available 48-96 hours after online publication and is updated daily on week days.
Initial download of the metrics may take a while.