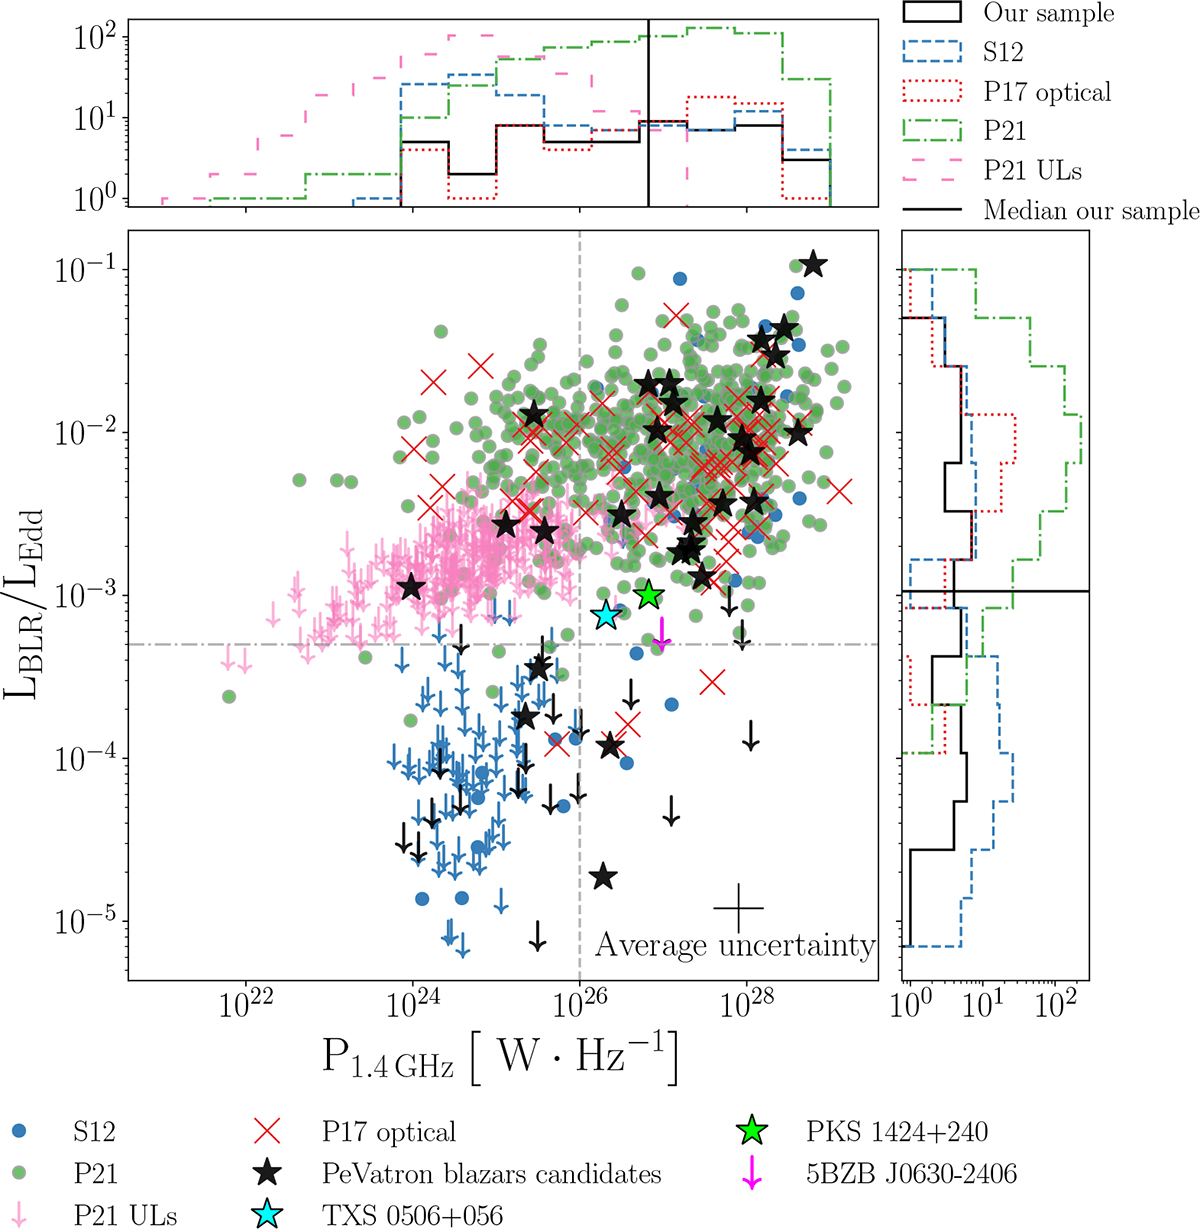
Fig. 3.
Download original image
Accretion regime LBLR/LEdd as a function of the radio power at 1.4 GHz, compared to the samples of (S12, P17, and P21 in the plot, Sbarrato et al. 2012; Paliya et al. 2017, 2021, see Sect. 3.2 for further details). For P17 we plot the subsample whose properties are analyzed through optical spectroscopy. The arrows indicate the upper limits on the optical luminosity. The three blue FSRQs (masquerading BL Lacs) TXS 0506+056, PKS 1424+240, and 5BZB J0630-2406 that were already identified as promising neutrino-emitter blazar candidates are highlighted in cyan, lime, and magenta, respectively (see Sect. 6.3). The dashed horizontal gray line represents the separation limits for the accretion efficiency LBLR/LEdd ∼ 5 × 10⁻⁴ (Ghisellini et al. 2011b; Sbarrato et al. 2012). Instead, the vertical dotted line is the threshold P1.4 GHz ∼ 1026 W ⋅ Hz−1 above which HERGs dominate over LERGs (Best & Heckman 2012; Padovani et al. 2019). On the sides are the normalized histograms of the corresponding quantities for the samples, excluding all the upper limits. Here, the black solid lines represent the median value for the candidate PeVatron blazars.
Current usage metrics show cumulative count of Article Views (full-text article views including HTML views, PDF and ePub downloads, according to the available data) and Abstracts Views on Vision4Press platform.
Data correspond to usage on the plateform after 2015. The current usage metrics is available 48-96 hours after online publication and is updated daily on week days.
Initial download of the metrics may take a while.