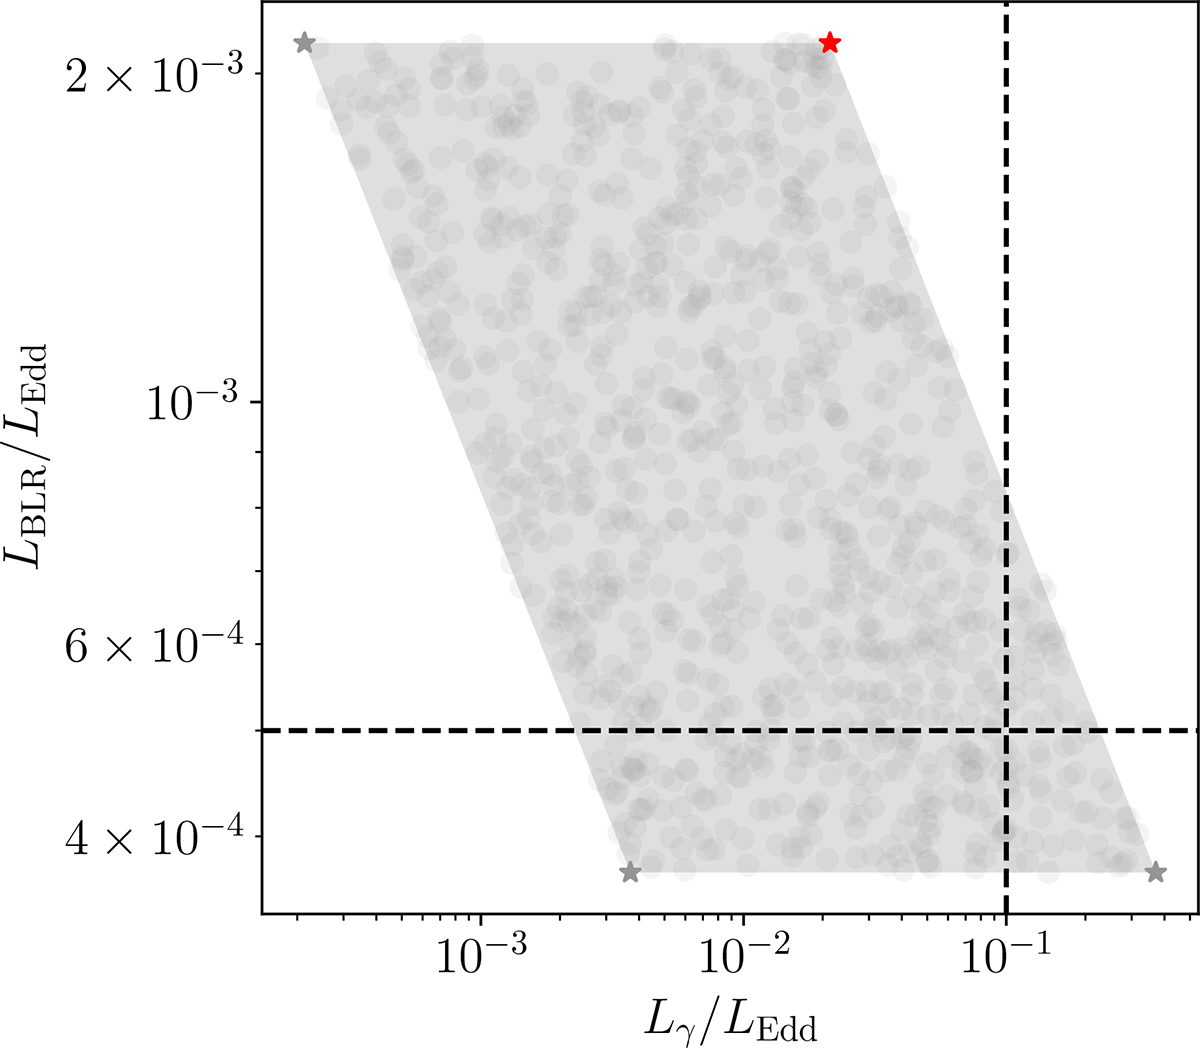
Fig. C.1.
Download original image
Trend of the accretion regime LBLR/LEdd as a function of Lγ/LEdd in the case of upper limits on both the optical and γ-rays. The red star is the chosen initial value, the gray points indicate the region spanned when the three quantities LBLR, LEdd, and Lγ vary. The gray stars represent the final values of the parameter simulation. The dotted black lines represent the separation limits for the accretion efficiency, respectively LBLR/LEdd ∼ 5 × 10⁻⁴ and Lγ/LEdd ∼ 0.1 (Ghisellini et al. 2011b; Sbarrato et al. 2012). In this case, LBLR varies between [1044,1046] erg ⋅ s−1, Lγ between [1045,1047] erg ⋅ s−1.
Current usage metrics show cumulative count of Article Views (full-text article views including HTML views, PDF and ePub downloads, according to the available data) and Abstracts Views on Vision4Press platform.
Data correspond to usage on the plateform after 2015. The current usage metrics is available 48-96 hours after online publication and is updated daily on week days.
Initial download of the metrics may take a while.