Fig. D.1.
Download original image
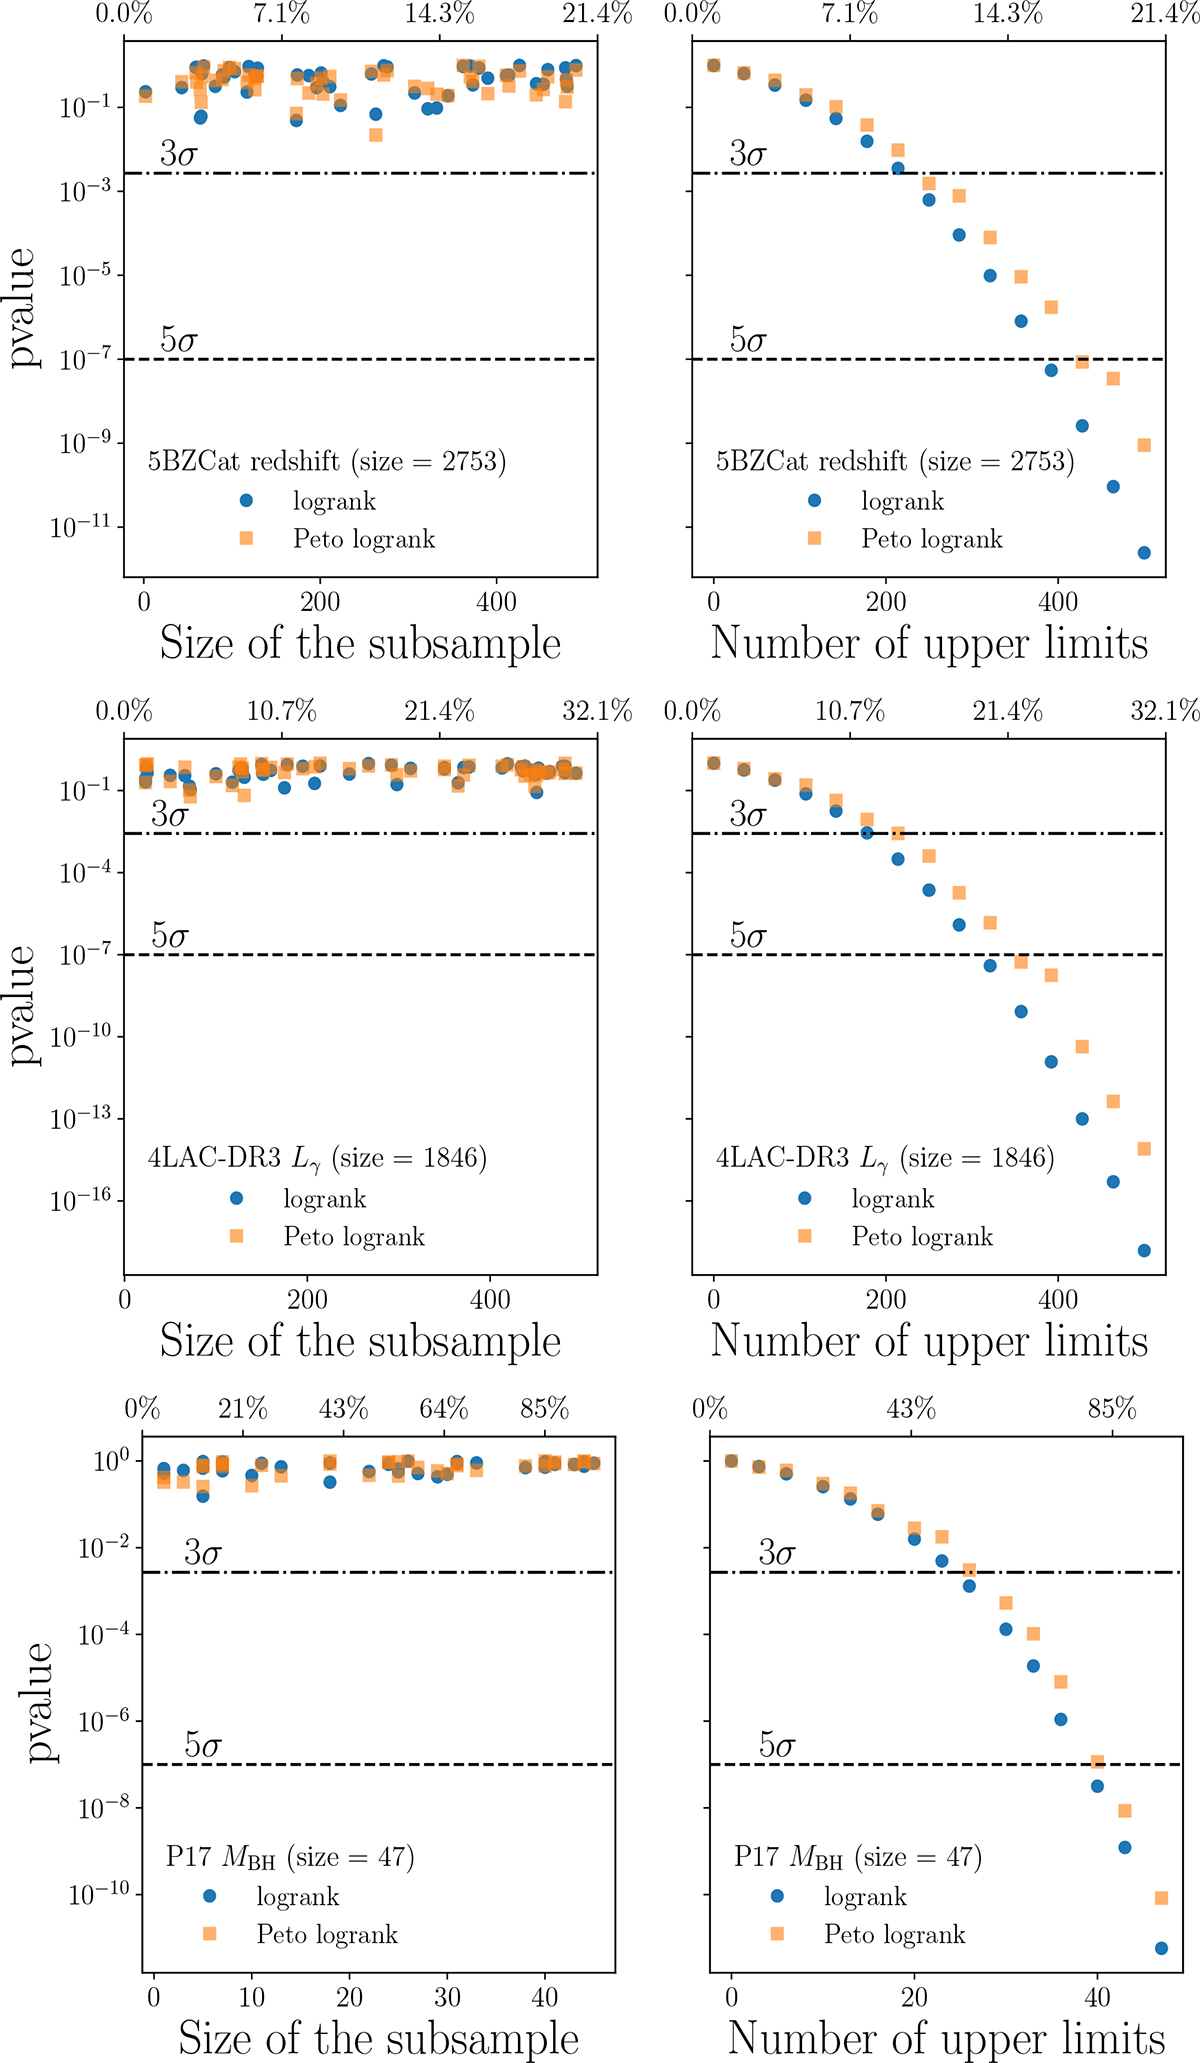
Redshift distribution of 5BZCat (top), the Lγ distribution of 4LAC-DR3 (middle) and the MBH distribution of P17 (bottom) are used to access the reliability of the statistical approaches. The left panels show the result of the logrank (blue points) and Peto logrank tests (orange squares) performed on the original population (only measurements) vs. comparison subsamples of progressively larger size, constructed by randomly selecting measured values from the parent dataset. The pvalue is shown as a function of the size of the selected subsample. The right panels show the result of the logrank (blue points) and Peto logrank (orange squares) tests performed on the parent populations (only measurements) vs. mock samples of the same size as the parent population, where a progressively larger number of values is flagged as censored data. The pvalue is shown as a function of the number of limits. In both panels, the upper axis indicates the percentage with respect to the total size of the sample (see Appendix D).
Current usage metrics show cumulative count of Article Views (full-text article views including HTML views, PDF and ePub downloads, according to the available data) and Abstracts Views on Vision4Press platform.
Data correspond to usage on the plateform after 2015. The current usage metrics is available 48-96 hours after online publication and is updated daily on week days.
Initial download of the metrics may take a while.