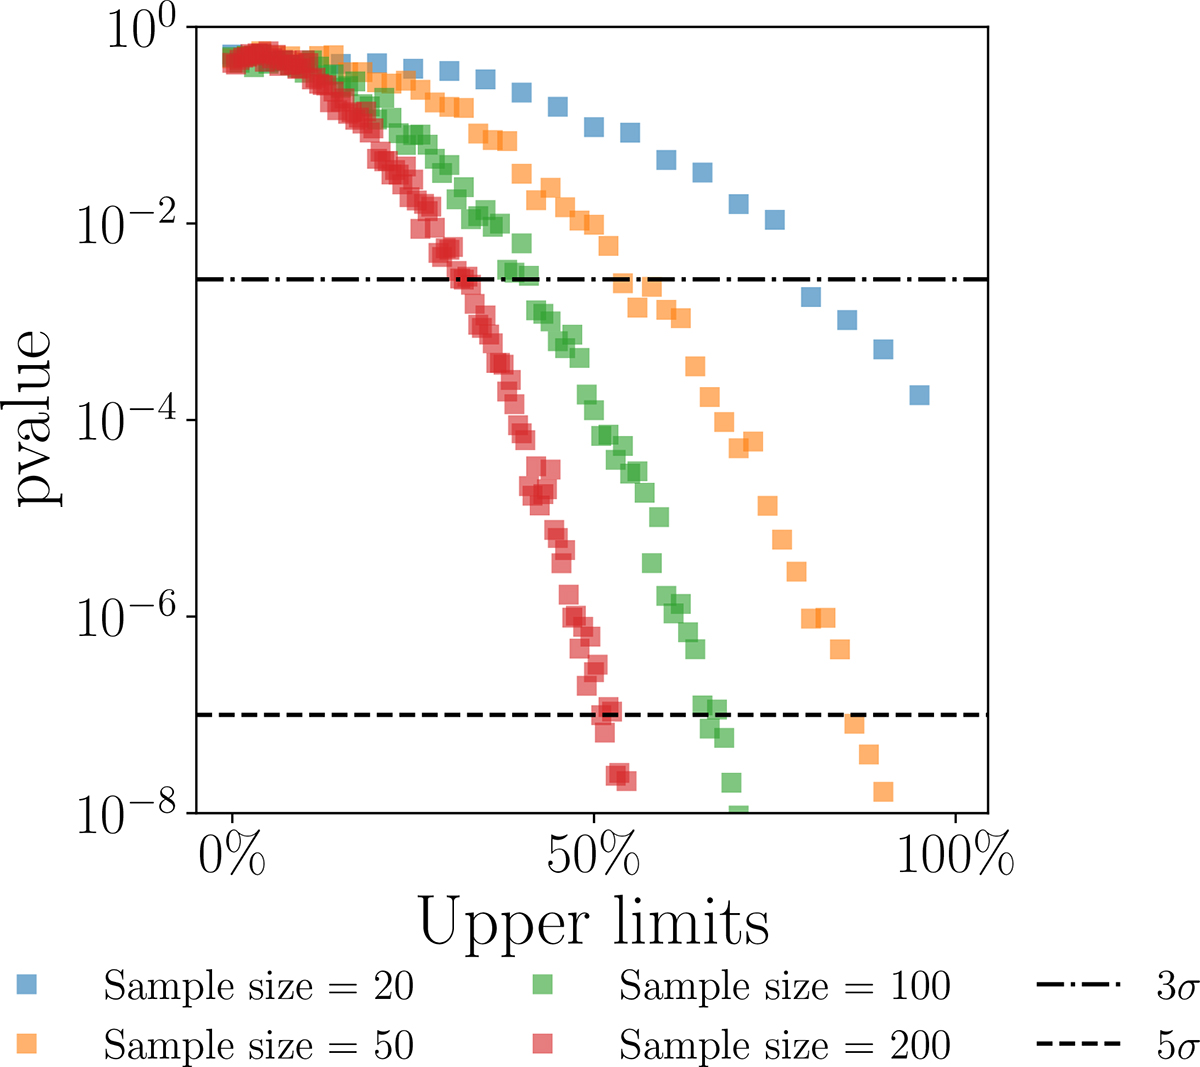
Fig. D.2.
Download original image
Peto logrank pvalues as a function of the number of upper limits (in percentage with respect to the total sample size). From the 5BZCat redshift sample, two subsamples of equal size were extracted: the first is kept unmodified (only measurements), in the second a progressively larger number of measurements were flagged as UL. In this way, the second subsample includes both measurements and censored data. The Peto logrank test was applied to subsamples of the same size at each step. The results for subsample size =20 in blue, 50 in orange, 100 in green, and 200 in red are shown by plotting, for each case, the median of the pvalues obtained over 100 realizations.
Current usage metrics show cumulative count of Article Views (full-text article views including HTML views, PDF and ePub downloads, according to the available data) and Abstracts Views on Vision4Press platform.
Data correspond to usage on the plateform after 2015. The current usage metrics is available 48-96 hours after online publication and is updated daily on week days.
Initial download of the metrics may take a while.