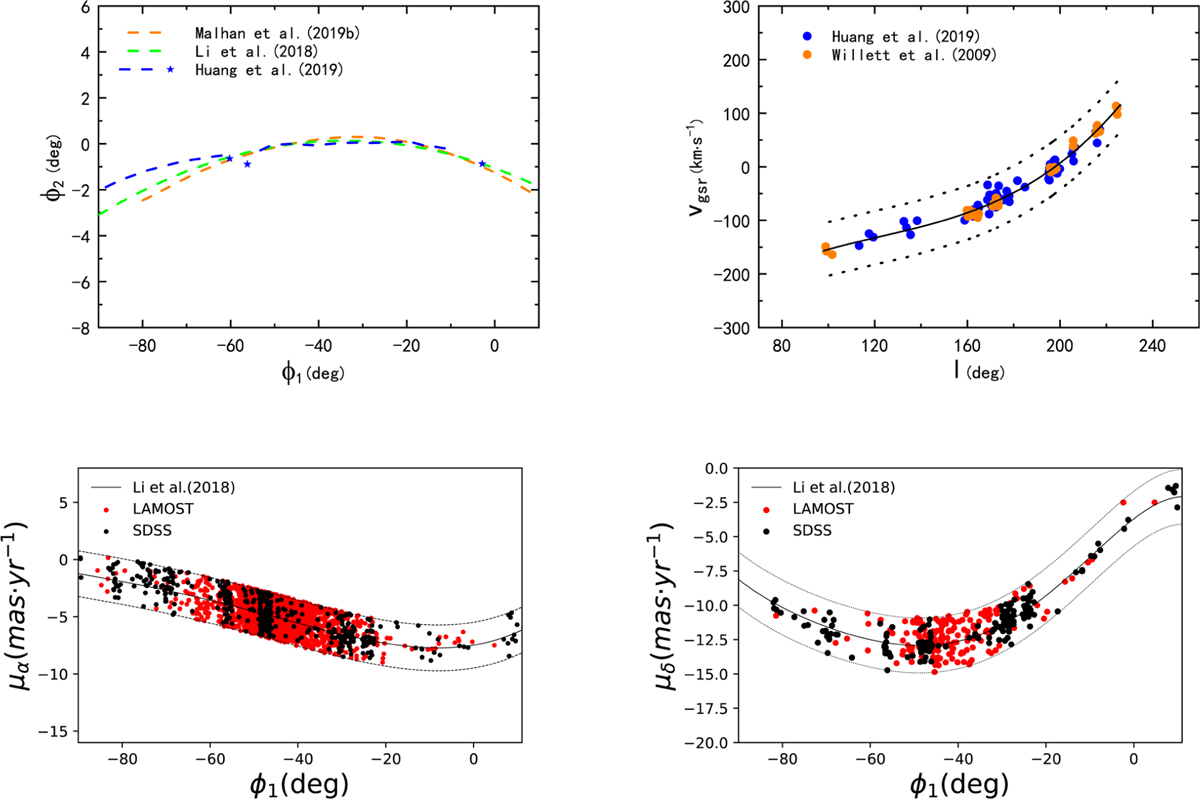
Fig. 1
Download original image
The upper-left panel compares GD-1 stream trails proposed by Li et al. (2018), Huang et al. (2019), and Malhan et al. (2019b). The upper-right panel shows the velocity-fitting of members from Willett et al. (2009) and Huang et al. (2019). The lower panels display the stellar proper motion distributions (μα, μδ) along with the fitting line from Li et al. (2018). In lower-left panel, red and black dots indicate stars remaining after the first and second steps of selection.
Current usage metrics show cumulative count of Article Views (full-text article views including HTML views, PDF and ePub downloads, according to the available data) and Abstracts Views on Vision4Press platform.
Data correspond to usage on the plateform after 2015. The current usage metrics is available 48-96 hours after online publication and is updated daily on week days.
Initial download of the metrics may take a while.