| Issue |
A&A
Volume 700, August 2025
|
|
|---|---|---|
| Article Number | A13 | |
| Number of page(s) | 11 | |
| Section | Galactic structure, stellar clusters and populations | |
| DOI | https://doi.org/10.1051/0004-6361/202451351 | |
| Published online | 29 July 2025 | |
Metallicity and motion of GD-1 and Kshir tidal streams
1
Shandong Provincial Key Laboratory of Optical Astronomy and Solar-Terrestrial Environment, School of Space Science and Technology, Shandong University at Weihai,
Weihai
264209,
China
2
CAS Key Laboratory of Optical Astronomy, National Astronomical Observatories, Chinese Academy of Sciences,
Beijing
100101,
China
3
School of Astronomy and Space Science, University of Chinese Academy of Sciences,
Beijing
100049,
China
★ Corresponding author: This email address is being protected from spambots. You need JavaScript enabled to view it.
Received:
2
July
2024
Accepted:
16
June
2025
Abstract
Aims. To explore the metallicity and kinematic properties of stellar streams, we selected the members of the GD-1 and Kshir streams, and conducted a detailed analysis of their member stars.
Methods. By utilizing the spectral data from LAMOST DR10 and SDSS DR16, and integrating them with astrometric data from Gaia DR3, we identified member stars of the stellar streams through an analysis of their geometric space, velocity space, and metallicity properties. Based on these identified member stars, we summarize the metallicity and kinematic properties of the stellar streams.
Results. We identified 152 members in the GD-1 stream and 68 members in the Kshir stream. The average metallicity of the GD-1 stream is [Fe/H]=−2.19 ± 0.10 dex. We confirmed the known gaps at ϕ1=−20° and ϕ1=−40° and identified a possible new gap at ϕ1=−60°. For the first time, we report that the gaps form because of a large velocity difference on both sides and a reversal of velocities at both ends of the stream. These velocity characteristics may be due to the gaps being near a “turnaround” point in the stream orbit, or the stellar stream being significantly impacted by the massive Sagittarius 3 Gyr ago. The average metallicity of the Kshir stream is [Fe/H]=−1.65 ± 0.13 dex. The radial velocity and proper motion distributions along the Kshir stream are consistent with those of the GD-1 stream. They likely represent orbital wraps of the same structure.
Key words: stars: abundances / Galaxy: evolution / Galaxy: halo / Galaxy: structure
© The Authors 2025
 Open Access article, published by EDP Sciences, under the terms of the Creative Commons Attribution License (https://creativecommons.org/licenses/by/4.0), which permits unrestricted use, distribution, and reproduction in any medium, provided the original work is properly cited.
This article is published in open access under the Subscribe to Open model. This email address is being protected from spambots. You need JavaScript enabled to view it. to support open access publication.
1 Introduction
In recent years, the successful implementation of large-scale surveys and the release of survey data have provided astronomers with more opportunities to study the origin and structure of the Milky Way. Stellar streams are stellar aggregations that form when dwarf galaxies or globular clusters (GCs) are disrupted by the tidal forces within the Milky Way (Eggen 1996; Zhang et al. 2017). The GD-1 stream was discovered by Grillmair & Dionatos (2006). The stream extends approximately 63°, and is relatively narrow. It is situated 8.5 kpc above the Galactic disk and has a relatively low metallicity. Willett et al. (2009) utilized velocity and metallicity information from SDSS and Sloan Extension to fit the orbit of the GD-1 stream. The derived retrograde orbit has an eccentricity e=0.33 (with a perigalacticon of 14.4 kpc and an apogalacticon of 28.7 kpc), an inclination i ∼ 35°, a distance from the Sun of about 7−11 kpc, and an average metallicity of [Fe/H]=−2.1 ± 0.1 dex. Koposov et al. (2010) constructed a six-dimensional phase-space map of the stream, which yielded a circular velocity Vc = 224 ± 13 km s−1 at the radius of the Sun. Using Gaia DR2 and Pan-STARRS photometry, Price-Whelan & Bonaca (2018) identified the GD-1 stream gap and proposed that the possible origin of the stream was at (ϕ1=−13.5°, ϕ2=−0.5°) in the GD-1 coordinate system (Koposov et al. 2010). Li et al. (2018) employed SDSS and LAMOST data to update the GD-1 stream fitting model. They found an age of ∼ 13 Gyr, [Fe/H]=−2.2 ± 0.12 dex, and the distance from the Sun of ∼ 8 kpc, and also indicated that the possible origin of the GD-1 stream is located at (RA=178.18°, Dec=52.19°). Huang et al. (2019) identified 67 members of the GD-1 stream through the SDSS survey, LAMOST survey, and Gaia DR2, and mapped the ϕ1−μα, ϕ1−μδ, and ϕ1−vgsr diagrams of the GD-1 stream.
Malhan et al. (2019a) discovered a new stellar structure, “Kshir”, which intersects the GD-1 stream on the sky. Kshir lies at a similar distance (approximately 10 kpc from the sun), while GD-1 is about 8−12 kpc from the Sun. They report a remarkable kinematic correlation between Kshir and GD-1 and propose several explanations: (1) they are orbital wraps of the same structure, (2) it is a chance alignment of two independent GCs, or (3) they have a common origin.
In this work, we use data from LAMOST (Zhao et al. 2012) DR10 and SDSS DR16 to determine the members of the streams and study their characteristics. We describe the properties of GD-1 in Section 2 and present those of Kshir in Section 3. In Section 4, we discuss the distribution of GD-1 giant members, and we present the conclusions in Section 5.
2 Members and properties of the GD-1 stream
In this section, we select stellar-stream candidates within the geometric space and velocity space using data from two distinct surveys, LAMOST DR10 and SDSS DR16, which exhibit a systematic discrepancy in their spectral parameters. Huang et al. (2019) compared more than 2000 common stars, finding that the [Fe/H] value in the LAMOST data is 0.06 dex higher than that in the SDSS data, while there is no significant error in the line-of-sight velocity. We apply the conclusion of Huang et al. (2019) to rectify the discrepancy between the LAMOST DR10 and SDSS DR16 datasets.
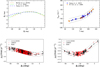 |
Fig. 1 The upper-left panel compares GD-1 stream trails proposed by Li et al. (2018), Huang et al. (2019), and Malhan et al. (2019b). The upper-right panel shows the velocity-fitting of members from Willett et al. (2009) and Huang et al. (2019). The lower panels display the stellar proper motion distributions (μα, μδ) along with the fitting line from Li et al. (2018). In lower-left panel, red and black dots indicate stars remaining after the first and second steps of selection. |
2.1 Selection of GD-1 members
As the first step in our selection process, we defined the position of the stream. Grillmair & Dionatos (2006) found the GD-1 stream using SDSS and reported that the stream extended 63° in (ϕ1, ϕ2), from (RA, Dec) = (140°, 25°) to (RA, Dec) =(220°, 55°). Willett et al. (2009) noted that a third-order polynomial was used to determine the position of the stream, the width within about 0.6° for 130° < RA < 175°, and within approximately 1° for 120° < RA < 130° and 175° < RA < 220°. Li et al. (2018) use a second-order polynomial to fit the positions of stream members:
 (1)
valid over the range −85° to 5°. The total width of the stream in this range is 1°. We compared the stream trails proposed by Li et al. (2018), Huang et al. (2019), and Malhan & Ibata (2019) in the upper-left panel of Fig. 1, and find that the position of the stream is nearly identical from −60° to −3°, with some differences at other positions. In our study, we chose the second-order polynomial from Li et al. (2018). To investigate properties near the stream or its extension, we set the width to 1.0°.
(1)
valid over the range −85° to 5°. The total width of the stream in this range is 1°. We compared the stream trails proposed by Li et al. (2018), Huang et al. (2019), and Malhan & Ibata (2019) in the upper-left panel of Fig. 1, and find that the position of the stream is nearly identical from −60° to −3°, with some differences at other positions. In our study, we chose the second-order polynomial from Li et al. (2018). To investigate properties near the stream or its extension, we set the width to 1.0°.
In the second step, we selected candidates by constraining the GD-1 stream in the velocity space, specifically in the Galactic Longitude – radial velocity (vgsr) space. We compiled a total of 115 highly probable GD-1 stream candidates from Willett et al. (2009) and Huang et al. (2019). A fourth-order polynomial was obtained by fitting the collected candidate data, as shown in the upper-right panel of Fig. 1. The fourth-order polynomial is
 (2)
(2)
In this polynomial, vgsr is defined according to Shi et al. (2012):
 (3)
where RV is the heliocentric radial velocity. In this step, we set 50 km/s as the width between the boundaries and the fitting line.
(3)
where RV is the heliocentric radial velocity. In this step, we set 50 km/s as the width between the boundaries and the fitting line.
The third step of our selection process involved selecting candidates based on their proper motions. To obtain proper motion, we cross-matched the stars with Gaia DR3 within a radius of 1′′. The limiting conditions for proper motion follow Li et al. (2018), as shown in the lower panels of Fig. 1, and are
 (4)
(4)
 (5)
(5)
The filter width was 2 mas/yr. After applying this filter, 281 candidates remained in LAMOST DR10, and 187 candidates remained in SDSS DR16.
Previous studies have indicated that the GD-1 stream has low metallicity. Since the stream is situated close to the disk of the Milky Way, the fourth step of our selection process involved minimizing the influence of disk stars on candidate selection. To achieve this, we set the criterion [Fe/H] ≤ −1.5 dex. This criterion is consistent with that used by Malhan & Ibata (2019). From the LAMOST DR10 data, we identified 37 candidates, and from the SDSS DR16 data, we obtained 157 candidates. Some stars were observed multiple times by both LAMOST and SDSS. After removing these duplicate observations, 172 members were retained within the GD-1 stream.
Figure 2 presents the color-magnitude diagram of the GD-1 stream member stars from our current study, together with data from Willett et al. (2009), Li et al. (2018), and Huang et al. (2019). The magnitudes were determined by cross-matching with Gaia DR3. In the fifth step of our selection process, we employed the same dereddening method as outlined by Yang et al. (2023). All stars underwent an extinction correction using the maps provided by Schlegel et al. (1998), which were subsequently recalibrated by Schlafly & Finkbeiner (2011) with a value of RV = 3.1. The assumed correction factors were AG/AV =0.83627, ABP/AV = 1.08337, and ARP/AV = 0.63439. In Fig. 2, the color-magnitude distributions of most data from our study, as well as those from Willett et al. (2009), Li et al. (2018), and Huang et al. (2019), exhibit good agreement along an isochrone with an approximate age of 10 Gyr, a distance of 10 kpc, and [Fe/H] of approximately −2.1 dex. This is consistent with the findings presented in Malhan et al. (2019a). Taking into account the uncertainty in reddening, we selected member stars as those that deviate from the 10 Gyr track for [Fe/H]=−2.1 by less than 0.2 mag in (BP−RP)0 and less than 0.8 mag in G0. With this criterion, 20 stars that deviated significantly from this isochrone were excluded from the subsequent analysis.
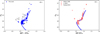 |
Fig. 2 Color-magnitude diagram of GD-1 member stars. The left panel shows stars identified in this work, with gray points representing stars that deviate significantly from the isochrone. The right panel shows GD-1 member stars from Willett et al. (2009), Li et al. (2018), and Huang et al. (2019). Magnitudes were obtained by cross-matching with Gaia Dr3. The isochrone corresponds to an age of 10 Gyr, a distance of 10 kpc, and a metallicity of −2.1 dex. |
2.2 Selection results
After the selection process, we obtained a total of 152 high-probability candidates, including 59 new ones. These new candidates do not overlap with those presented in the works of Willett et al. (2009), Li et al. (2018) and Huang et al. (2019). In accordance with the approach described by Malhan & Ibata (2019), the tangential velocity of a star is calculated by multiplying its proper motion by the model distance. Gaia provides highly accurate proper motion measurements. Reino et al. (2021) use the distances from Koposov et al. (2010) and Li et al. (2018) to fit a polynomial to the track of the GD-1 stream. The resulting function is then used to predict the distances to each member of the stream, depending on their position along the stream. By applying the GD-1 stream distance model proposed by Reino et al. (2021), we determined the model distances of the 152 members and computed their tangential velocities. Details of the members are presented in Table A.1. Columns 1-11 of Table A.1 show RA, Dec, RV, [Fe/H], ϕ1, ϕ2, μα, μδ, Vgsr, model distance, and tangential velocity. In column 12, the labels “L” and “S” denote data sources from LAMOST and SDSS, respectively. In column 13, the label “N” indicates that the members are newly identified in this work.
We investigated the morphological characteristics of the GD-1 stream using the 152 candidate members. As depicted in the left panel of Fig. 3, the extent of the stream’s elongation along ϕ1 is approximately 80 degrees. When compared to the length (63 degrees) reported by Grillmair & Dionatos (2006), the GD-1 stream has extended by ∼ 20°. In the ϕ1−ϕ2 plane, the GD1 stream is discontinuous and can be divided into four parts. Clustering of members is evident in the intervals (ϕ1=−60°, ϕ1=−40°) and (ϕ1=−40°, ϕ1=−20°), while almost no member stars are found at ϕ1=−40° and ϕ1=−20°. The GD-1 stream has gaps at ϕ1=−40° and ϕ1=−20°, which is consistent with the findings of Price-Whelan & Bonaca (2018) and de Boer et al. (2018). Additionally, there are members clustered in the interval (ϕ1=−80°, ϕ1=−60°), and a distinct break is observed at ϕ1=−60°. Thus, we hypothesize that there is a possible new gap at ϕ1=−60°. To examine the distribution properties of these stars, we collected the members as comprehensively as possible from the works of Willett et al. (2009), Li et al. (2018), Huang et al. (2019) and others. The combined distribution of the members selected by previous researchers and our own members is shown in the right panel of Fig. 3, where the gap at ϕ1=−60° remains clearly discernible.
To test the authenticity of the gap, we performed a Kolmogorov-Smirnov (KS) test on two samples: the “gap samples” and “stream samples”. We define gap samples as those located within the gap region (−64° < ϕ1 < −57.5°) but not belonging to the stream members. Specifically, within this gap region, these samples satisfy the first and second steps outlined in Section 2.1 but fail to meet the third step. Consequently, such samples are possibly positioned in the gap but are not members of the stream. We define stream samples as GD-1 members located to the left of ϕ1=−40° in the lower-left panel of Fig. 3. We performed the KS test on the gap (gap samples, n = 160) and the stream (stream samples, n = 62), yielding a test statistic of D = 0.95 (p < 0.05). This highly significant D-value indicates a substantial difference between the two distributions, suggesting that the gap is unlikely to be part of the stream component. This provides evidence that the ϕ1=−60° region is highly likely a gap.
The formation of the gaps in the GD-1 stream may be attributed to multiple factors and it is likely that the members on either side of these gaps exhibit distinct characteristics. The velocities of the members on both sides of the gap at ϕ1=−60° and those on both sides of the gap at ϕ1=−40° are illustrated in Fig. 4. The members on both sides of the gap have different velocities, and the velocity distribution features obvious peaks, indicating that, from the perspective of velocity, these can be regarded as two independent components. The metallicity distribution of the GD-1 stream is shown in Fig. 5. The metallicity values are predominantly distributed within the range of [−2.5 dex, −1.7 dex], and, based on our data, the average metallicity of the stream is [Fe/H]=−2.19 ± 0.10 dex. This result is comparable to the [Fe/H]=−2.24 ± 0.21 dex reported by Malhan & Ibata (2019).
Studying the metallicity distribution of the GD-1 stream is instrumental in exploring the origin and evolution of this stream. The left panel of Fig. 6 illustrates the distribution of GD-1 stream candidates in the ϕ1−ϕ2 plane, where differences in metallicity are depicted by various colors. We observed that the metallicity at the left endpoint is slightly higher, yet it remains relatively uniform along the entire stream. The metallicities of the GD-1 members selected from the works of Willett et al. (2009), Li et al. (2018), and Huang et al. (2019) are presented in the right panel of Fig. 6, demonstrating a consistent distribution pattern. The metallicity characteristics of the GD-1 stream are likely related to its progenitor, which has been determined to be a globular cluster with a homogeneous metallicity. Previous studies have also proposed that the origin of the stream is located at ϕ1 = −10° (Price-Whelan & Bonaca 2018; Malhan et al. 2019b).
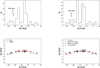 |
Fig. 3 Position distribution of GD-1 member stars. The left panels show the distribution of the 152 members identified in this work. The right panels show the position distribution of our members and the members from Willett et al. (2009), Li et al. (2018) and Huang et al. (2019). The newly identified gap is also indicated in the upper panels. |
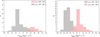 |
Fig. 4 Distribution of vgsr for our member stars at both sides of the gap at ϕ1=−60° (left panel) and ϕ1=−40° (right panel). |
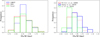 |
Fig. 5 Left panel: comparison of [Fe/H] for members from LAMOST and SDSS. Right panel: comparison of [Fe/H] reported by Willett et al. (2009), Li et al. (2018), and Huang et al. (2019). |
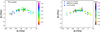 |
Fig. 6 Left panel: metallicity distribution of GD-1 members along the stream, as determined in this work. Right panel: metallicity distribution from previous studies. |
2.3 Dynamic properties
In this section, we analyze the dynamic properties of the GD-1 stream in terms of velocity and proper motion. To clearly illustrate the distribution characteristics of the GD-1 stream, we use different colors to represent the velocity and proper motion along the stream in Fig. 7. The Vgsr distribution of 152 members along the stream is depicted in the upper-left panel of Fig. 7. It is evident that the Vgsr values of the members are higher at both ends of the stream compared to the middle section. Similarly, the members selected by Willett et al. (2009), Li et al. (2018), and Huang et al. (2019), as shown in the upper-right panel of Fig. 7, display the same characteristic pattern. Based on the positive and negative values of Vgsr, the right part of the GD-1 stream exhibits a stronger tendency to move toward the Sun, while the left part shows a more pronounced trend of moving away from the Sun.
Price-Whelan & Bonaca (2018) indicated that the density distribution along the GD-1 stream is nonuniform. Specifically, there are two low-density zones situated at ϕ1=−20° and ϕ1=−40°, respectively. They also hypothesized that the origin position of the GD-1 stream is at (ϕ1, ϕ2)=(−13.5°,−0.5°). As depicted in the upper panels of Fig. 7, the velocities on both sides of ϕ1=−20° and ϕ1=−60° exhibit differences. The location where the velocity is approximately zero is ϕ1 = −45°. When extending outward from both sides of ϕ1 = −45°, the velocities are observed to increase. Given these velocity discrepancies, it can be inferred that the gaps in the GD-1 stream will gradually widen, ultimately leading to the stream’s fragmentation into several segments.
Proper motion refers to the angular distance that a star traverses in a year, which essentially represents its transverse motion. The proper motion discussed here is the total proper motion of the star, calculated as  . As illustrated in the lower panels of Fig. 7, the proper motions in the ϕ1−ϕ2 plane exhibit distinct distribution characteristics. Interestingly, the proper motion distribution of the GD-1 stream is contrary to its velocity distribution. Specifically, the proper motion of the stream is relatively smaller at both ends and larger in the middle section. Based on the definition of proper motion, this can be interpreted as the stars located in the middle of the stream having a greater lateral displacement, while the stars at the two ends of the stream experience a smaller lateral displacement.
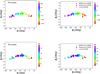 |
Fig. 7 Left panels: velocity (vgsr) and proper motion distribution of GD-1 members along the stream, as determined in this work. Right panels: velocity (vgsr) and proper motion distribution of GD-1 members along the stream from previous studies. |
3 Kshir stream
3.1 Selection of Kshir members
Malhan et al. (2019a) reported the discovery of a new stellar structure named “Kshir” in the vicinity of the GD-1 stream, exhibiting a remarkable kinematic correlation with it. Using data from Gaia DR2, SDSS DR10, and LAMOST DR4 they identified Kshir members and determine a mean metallicity of [Fe/H]= −1.78 ± 0.21 dex. In this study, we selected Kshir members to investigate the characteristics, origin, and surrounding environment of both the GD-1 and Kshir streams. We adopted the same initial sample data as used for the GD-1 stream, specifically SDSS DR16, LAMOST DR10, and Gaia DR3. The Kshir members were selected based on four criteria: (1) position, (2) velocity, (3) proper motions, and (4) metallicity, similar to the approach described in Malhan et al. (2019a). We initially used [Fe/H] ≤ −0.5 dex, as suggested by Malhan et al. (2019a), as the metallicity threshold; however, we identified some contaminating sources. We therefore adjusted the metallicity threshold to [Fe/H] ≤ −1.0 dex. As a result, 88 candidates remained. After removing duplicate data from the LAMOST and SDSS datasets, 78 candidates were retained within the Kshir stream.
Fig. 8 displays the color-magnitude diagram of the Kshir stream member stars from our current study and those from Malhan et al. (2019a). The magnitudes were determined by cross-matching with Gaia DR3. By applying the same dereddening method as used for the GD-1 stream, as previously described, we observed that the color-magnitude distributions of most of the data from our study and Malhan et al. (2019a) show good agreement. The isochrone of the Kshir stream closely resembles that of the GD-1 stream, as reported by Malhan et al. (2019a). Consequently, an isochrone identical to that of the GD-1 stream is plotted in Fig. 8. Considering the uncertainty in the reddening process, we selected the member stars as those whose deviations from the 10−Gyr track for [Fe/H]=−2.1 are less than 0.3 magnitudes in (BP−RP)0 and less than 0.8 magnitudes in G0. Based on this criterion, we excluded ten stars that exhibited significant deviations from the isochrone from the analysis. Kshir member stars deviate from the 10 Gyr isochrone, likely due to uncertainty in reddening. Further study is desirable in the future.
Finally, we obtained 68 members of the Kshir stream, among which 63 are new members (listed in Table A.2). Columns 1–10 of Table A.2 present the same parameters as those in Table A.1. In column 11, the label “N” indicates that the candidates are new and do not overlap with the data reported in Malhan et al. (2019a). The average metallicity of the Kshir members is [Fe/H]=−1.65 ± 0.13 dex, which is consistent with the value reported by Malhan et al. (2019a).
The Kshir and GD-1 streams are located at similar distances (approximately ∼ 10 kpc away for Kshir and 8−12 kpc for GD-1). As noted in Malhan et al. (2019a), these two stellar structures might have the same origin. The positional relationship, where the streams intersect, in the ϕ1−ϕ2 plane is clearly visible in the left panel of Fig. 9. The extent of the Kshir stream along ϕ1 is approximately 90 degrees. Compared to the length (80 degrees) reported by Malhan et al. (2019a), the Kshir stream has extended by ∼ 10°, specifically in the range of ϕ1=−60° ∼ −70°. We compared the metallicities of the members within the ϕ1=−60° ∼ −70° region with those of all the data points in the Kshir stream. We find that their metallicities are consistent, confirming the validity of the observed extension. The intersection point is at ϕ1=−20°, and the location of the progenitor of the GD-1 stream is at ϕ1=−10°, indicating that the intersection point and the progenitor are in close proximity.
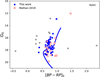 |
Fig. 8 Color-magnitude diagram of Kshir members from Malhan et al. (2019a) and this work. Gray stars far from the isochrone have been removed. Magnitudes were obtained by cross-matching with Gaia DR3. The isochrone is the same as that used for the GD-1 stream. |
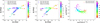 |
Fig. 9 Comparison of the position, proper motion and velocity (vgsr) of the Kshir and GD-1 streams. Kshir members from Malhan et al. (2019a) are also shown in left and middle panels. |
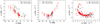 |
Fig. 10 Comparison of the proper motion (μα, μδ) of the Kshir stream and the GD-1 stream. The uncertainties are indicated by error bars. |
3.2 Kshir and GD-1 streams
Both the Kshir stream and the GD-1 stream exhibit a slender morphology and share similarities in terms of width and length. As depicted in Fig. 9, we use the same color to represent the Vgsr and proper motion for both the GD-1 and Kshir streams. The two stellar streams display identical proper motion distributions. Specifically, the proper motions are larger in the middle regions and smaller at the ends, and the corresponding positions of these features are consistent. In the intervals ϕ1=(−80°,−60°) and (−20°, 0°), both streams have relatively smaller proper motions, whereas in the interval of ϕ1=(−60°,−20°), the proper motions are larger. The location with the largest proper motion is around ϕ1=−40°, and the smallest proper motion is observed at the far right end of the streams. The two stellar streams intersect at ϕ1= −20°, where their proper motions are nearly identical. In contrast to the proper motion distribution, the velocity distribution shows an opposite pattern. The velocities of the GD-1 stream and the Kshir stream are higher at the two ends and lower at the middle. Moreover, the velocity at the left end of the streams is smaller than that at the right end, and the positions where the velocity is approximately zero are close to ϕ1=−45°. The GD-1 stream shares the same velocity distribution characteristics as the Kshir stream. This indicates a high degree of similarity in the motions of these two stellar streams. The analytical approach used for these two structures is similar to that used by Yan et al. (2023), who provide a detailed analysis of the kinematic properties of the Virgo overdensity and the Hercules-Aquila cloud.
To explore the relationship between the GD-1 stellar stream and the Kshir stellar stream, we compared the proper motions (μα, μδ) with associated errors of the two stellar streams, as illustrated in Fig. 10. In the left panel, μα exhibits the same distribution trend for both streams. It gradually decreases along the stellar streams, and the maximum and minimum values are nearly identical, being approximately −1 mas/yr and −9 mas/yr, respectively. The notable difference is that the proper motion of the Kshir stream is generally larger than that of the GD-1 stream, and the data points of the Kshir stream are positioned above those of the GD-1 stream. In the middle panel, the ϕ1−μδ distributions of the two streams also follow the same trend. They first decrease and then increase along the stellar streams. In the range of ϕ1=(−80°,−20°), the two streams are intertwined, making it difficult to distinguish them clearly. However, in the range of ϕ1=(−20°, 10°), they can be easily distinguished. In the right panel, the μα−μδ distributions of the two streams also show the same trend. However, they are intertwined within a certain region, and further analysis is needed to disentangle their specific characteristics.
Malhan et al. (2019a) proposed that the relationship between the Kshir stream and the GD-1 stream can be categorized into three types: (1) they are different segments of the same stream, and the [Fe/H] difference might be attributed to the metallicity gradient; (2) they are two independent streams originating from different globular clusters; (3) they are two streams that come from the same globular cluster. Based on our sample, the GD-1 stream and the Kshir stream exhibit strong similarities in their velocity and proper motion distributions, although their metallicities show some differences. We hypothesize that the GD-1 stream and the Kshir stream share the same origin from the same structure, which is situated at ϕ1=−10°.
The metallicity of the Arjuna/Sequoia/I’itoi group shows a wide range, ranging from −2.24 dex to −1.56 dex, with a median value of [Fe/H] ∼ −1.78 dex (Malhan et al. 2022). In this study, the median [Fe/H] of the Kshir stream is comparable to that of the Arjuna/Sequoia/I’itoi group, and the [Fe/H] of the GD-1 stream falls within the same range. Moreover, as reported in Malhan et al. (2019a), the orbit of Kshir is very similar to that of GD-1 within the Milky Way. We propose that the Kshir and GD-1 streams originated from the tidal stripping of the Arjuna/Sequoia/I’itoi progenitor galaxy, as suggested by Malhan et al. (2022). This provides a plausible explanation for the observation that the Kshir and GD-1 streams have similar orbits but distinct metallicities.
 |
Fig. 11 Velocity dispersion of the GD-1 stream (left) and Kshir stream (middle) along the line-of-sight direction. Right: Velocity dispersion of the GD-1 stream along the tangential direction. The dashed line indicates the 95% confidence level. |
3.3 Velocity dispersion of GD-1 and Kshir
The internal velocity dispersion in an isotropic system can be divided into a radial component and a tangential component. An important reason why the GD-1 stream is believed to originate in a globular cluster is its small velocity dispersion; the velocity dispersion of the tangential velocity is less than 2.3 km s−1 (Malhan & Ibata 2019). Malhan & Ibata (2019) also report that the velocity dispersion of the radial velocity is σ = 11.95 km s−1, based on 41 stars observed with low-resolution spectroscopy.
We employed a Markov Chain Monte Carlo (MCMC) algorithm similar to that in Malhan & Ibata (2019) to calculate the velocity dispersions of GD-1 and Kshir. The resulting distributions are presented in Fig. 11. In the line-of-sight direction, with 152 members of GD-1, we obtain a radial velocity dispersion σRV = 17.12 km s−1, and with 68 members of Kshir, we get σRV = 32.24 km s−1, both at the 95% confidence level. Since the radial velocity error provided by the LAMOST DR10 and SDSS DR16 data is somewhat large, the velocity dispersion of the GD-1 stream is higher than that reported by Malhan & Ibata (2019). The tangential velocity dispersion of the GD-1 stream is determined to be approximately σVT = 4.76 km s−1 (at the 95% confidence level). This result indicates that GD-1 is a dynamically cold system, suggesting that, so far, GD-1 has not experienced significant external heating. In Reino et al. (2021), there is no distance model for Kshir. As a result, we cannot calculate the model distances and tangential velocities for Kshir at this time. However, we plan to perform these calculations in future work once additional distance data become available.
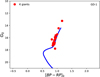 |
Fig. 12 Color-magnitude diagram of GD-1 giant members. Magnitudes are obtained by cross-matching with Gaia DR3. The isochrone is same as that of the GD-1 stream. |
4 Giant members of GD-1
4.1 Selection of giant members
To identify members of the GD-1 stream with known distances, we applied the same restrictions (the five-step selection method described in Section 2.1) to K giants (Liu et al. 2014) and RGB stars (Chen et al. 2014). As a result, we identified ten K giants and eight RGB stars within the GD-1 stream. Fig. 12 displays the color-magnitude diagram of the GD-1 giant members. These 18 stars are listed in Table A.3. We examined the temperature and log g values of these K giants and RGB stars and found that the K giants and RGB stars exhibit similar distribution patterns. Therefore, we classified these 18 stars (members of the GD-1 stream) as K giants. Too few stars met the selection criteria for Kshir members (described in Section 3.1), so we do not present the results of the K giant selection for Kshir.
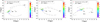 |
Fig. 13 Distribution of GD-1 members (dots) in the X–Y, X–Z, and Y–Z planes. Colored arrows indicate the movement direction of GD-1 members, the color shows the value of ϕ1. The black dashed line shows the orbit of the GD-1 stream, and the black arrow indicates the orbit direction (Willett et al. 2009). A red five-pointed star marks the location of ϕ1 = −60°. |
4.2 Distribution of giant members
The distribution of the 18 giants described above is shown in the X–Y, X–Z, and Y–Z planes of Fig. 13. In all three planes, the 18 members are distributed around the orbit of the GD-1 stream, which provides evidence for the validity of our member selection method. In the first panel of Fig. 13, the upper part (above Y ∼ −5 kpc) and the lower part (below Y ∼ −5 kpc) of the stellar stream exhibit different directions of motion. Similarly, the second panel of Fig. 13, also shows two distinct regions with motion patterns comparable to those in the first panel. The members in the lower part of the stream have velocity components directed towards the Sun, while those in the upper part have velocity components moving away from the Sun. This behavior aligns well with the analysis presented in Section 2.3.
The radial velocities at both ends of the GD-1 stream exhibit large values, while the velocities in the intermediate region are small. Moreover, the velocities at opposite ends have opposite signs (positive or negative). We speculate that the stream is situated near the turnaround point of its orbit, as illustrated in Fig. 13. The position where ϕ1 = 60° is marked with a red five-pointed star. The upper part of the stream is located on one side of the turnaround point; thus, the velocities are positive, indicating motion away from the Sun. Conversely, the lower part lies on the other side of the turnaround point, resulting in negative velocities that indicate motion toward the Sun. These factors result in substantial differences in stellar velocities on both sides of the gaps. The velocity disparities might be responsible for the formation of the gaps and could cause them to gradually widen. Another possible explanation is the influence exerted by the massive Sagittarius (Sgr) dwarf galaxy on the GD-1 stream approximately 3 Gyr ago, as reported by Reino et al. (2021). The impact of Sgr likely led to the formation of the gaps and contributed to the different velocities observed on either side of the gaps. Dillamore et al. (2022) also note that Sgr, with its considerable mass, is capable of significantly disrupting stellar streams within the inner halo of the Milky Way.
5 Conclusions
Using spectroscopic data from LAMOST DR10 and SDSS DR16, along with photometric data from SDSS DR16 and astrometric data from Gaia DR3, we constrained the position, velocity, proper motion, and metallicity of the GD-1 and Kshir stellar streams. Using this method, we identified a total of 152 members in the GD-1 stream and 68 members in the Kshir stream.
The average metallicity of the GD-1 stream is [Fe/H] = −2.19 ± 0.10 dex, and the tangential velocity dispersion is 4.76 km/s. We confirm the known gaps at ϕ1 = −20° and ϕ1 = −40°, and identify a possible new gap at ϕ1 = −60°.
We show that the gaps form due to differences in velocity distribution on either side of the gaps. This velocity difference causes the gaps to gradually widen.
The velocity differences on both sides of the gaps and the opposite velocities at both ends of the GD-1 stream may result from the stream being located near the orbital turnaround point, which divides the stream into different parts. Alternatively, these features could reflect significant disruption by the massive Sgr 3 Gyr ago.
The average metallicity of the Kshir stream is Fe/H] = −1.65 ± 0.13 dex. The radial velocity and proper-motion distributions along the Kshir stream are consistent with those of the GD-1 stream. These similarities suggest that both the GD-1 and Kshir streams originated from the same structure. It is highly likely that they are stellar streams formed by tidal stripping of the progenitor Arjuna/Sequoia/I’itoi galaxy.
Data availability
Full Tables A.1 and A.2 are available at the CDS via anonymous ftp to cdsarc.cds.unistra.fr (130.79.128.5) or via https://cdsarc.cds.unistra.fr/viz-bin/cat/J/A+A/700/A13.
Acknowledgements
We thank the referee for her helpful comments which significantly improved the paper. This study is supported by the National Key R&D Program of China Nos. 2024YFA1611903, 2024YFA1611902, 2023 YFE0107800 and the National Natural Science Foundation of China under grant nos. 12588202, 12273055. This study is also supported by International Partnership Program of Chinese Academy of Sciences. Grant No. 178GJHZ2022040GC. We acknowledge the support from the National Astronomical Observatories, CAS, under grant no.E4ZB0301 and the support from the China Manned Space Program with grant no. CMS-CSST-2025-A12. Guoshoujing Telescope (the Large Sky Area Multi-Object Fiber Spectroscopic Telescope LAMOST) is a National Major Scientific Project built by the Chinese Academy of Sciences. Funding for the project has been provided by the National Development and Reform Commission. LAMOST is operated and managed by the National Astronomical Observatories, Chinese Academy of Sciences.
Appendix A The members of GD-1 and Kshir streams
The members of GD-1 stream.
The members of Kshir stream.
Giant members of GD-1 stream.
References
- Chen, Y. Q., Zhao, G., Carrell, K., et al. 2014, ApJ, 795, 52 [Google Scholar]
- de Boer, T. J. L., Belokurov, V., Koposov, S. E., et al. 2018, MNRAS, 477, 1893 [NASA ADS] [CrossRef] [Google Scholar]
- Dillamore, A. M., Belokurov, V., Evans, N. W., & Price-Whelan, A. M., 2022, MNRAS, 516, 1685 [NASA ADS] [CrossRef] [Google Scholar]
- Eggen, O. J., 1996, AJ, 112, 1595 [CrossRef] [Google Scholar]
- Grillmair, C. J., & Dionatos, O., 2006, ApJ, 643, L17 [Google Scholar]
- Huang, Y., Chen, B. Q., Zhang, H. W., et al. 2019, ApJ, 877, 13 [Google Scholar]
- Koposov, S. E., Rix, H.-W., & Hogg, D. W., 2010, ApJ, 712, 260 [Google Scholar]
- Li, G.-W., Yanny, B., & Wu, Y. 2018, ApJ, 869, 122 [NASA ADS] [CrossRef] [Google Scholar]
- Liu, C., Deng, L.-C., Carlin, J. L., et al. 2014, ApJ, 790, 110 [CrossRef] [Google Scholar]
- Malhan, K., & Ibata, R. A., 2019, MNRAS, 486, 2995 [NASA ADS] [CrossRef] [Google Scholar]
- Malhan, K., Ibata, R. A., Carlberg, R. G., et al. 2019a, ApJ, 886, L7 [NASA ADS] [CrossRef] [Google Scholar]
- Malhan, K., Ibata, R. A., Carlberg, R. G., Valluri, M., & Freese, K. 2019b, ApJ, 881, 106 [NASA ADS] [CrossRef] [Google Scholar]
- Malhan, K., Ibata, R. A., Sharma, S., et al. 2022, ApJ, 926, 107 [NASA ADS] [CrossRef] [Google Scholar]
- Price-Whelan, A. M., & Bonaca, A., 2018, ApJ, 863, L20 [CrossRef] [Google Scholar]
- Reino, S., Rossi, E. M., Sanderson, R. E., et al. 2021, MNRAS, 502, 4170 [NASA ADS] [CrossRef] [Google Scholar]
- Schlafly, E. F., & Finkbeiner, D. P., 2011, ApJ, 737, 103 [Google Scholar]
- Schlegel, D. J., Finkbeiner, D. P., & Davis, M., 1998, ApJ, 500, 525 [Google Scholar]
- Shi, W. B., Chen, Y. Q., Carrell, K., & Zhao, G., 2012, ApJ, 751, 130 [NASA ADS] [CrossRef] [Google Scholar]
- Willett, B. A., Newberg, H. J., Zhang, H., Yanny, B., & Beers, T. C., 2009, ApJ, 697, 207 [Google Scholar]
- Yan, H. H., Shi, W. B., Chen, Y. Q., Zhao, J. K., & Zhao, G., 2023, A&A, 674, A78 [NASA ADS] [CrossRef] [EDP Sciences] [Google Scholar]
- Yang, Y., Zhao, J.-K., Tang, X.-Z., Ye, X.-H., & Zhao, G. 2023, ApJ, 953, 130 [Google Scholar]
- Zhang, X., Shi, W. B., Chen, Y. Q., et al. 2017, A&A, 597, A54 [NASA ADS] [CrossRef] [EDP Sciences] [Google Scholar]
- Zhao, G., Zhao, Y.-H., Chu, Y.-Q., Jing, Y.-P., & Deng, L.-C., 2012, Res. Astron. Astrophys., 12, 723 [NASA ADS] [CrossRef] [Google Scholar]
All Tables
All Figures
|
Fig. 1 The upper-left panel compares GD-1 stream trails proposed by Li et al. (2018), Huang et al. (2019), and Malhan et al. (2019b). The upper-right panel shows the velocity-fitting of members from Willett et al. (2009) and Huang et al. (2019). The lower panels display the stellar proper motion distributions (μα, μδ) along with the fitting line from Li et al. (2018). In lower-left panel, red and black dots indicate stars remaining after the first and second steps of selection. |
| In the text | |
|
Fig. 2 Color-magnitude diagram of GD-1 member stars. The left panel shows stars identified in this work, with gray points representing stars that deviate significantly from the isochrone. The right panel shows GD-1 member stars from Willett et al. (2009), Li et al. (2018), and Huang et al. (2019). Magnitudes were obtained by cross-matching with Gaia Dr3. The isochrone corresponds to an age of 10 Gyr, a distance of 10 kpc, and a metallicity of −2.1 dex. |
| In the text | |
|
Fig. 3 Position distribution of GD-1 member stars. The left panels show the distribution of the 152 members identified in this work. The right panels show the position distribution of our members and the members from Willett et al. (2009), Li et al. (2018) and Huang et al. (2019). The newly identified gap is also indicated in the upper panels. |
| In the text | |
|
Fig. 4 Distribution of vgsr for our member stars at both sides of the gap at ϕ1=−60° (left panel) and ϕ1=−40° (right panel). |
| In the text | |
|
Fig. 5 Left panel: comparison of [Fe/H] for members from LAMOST and SDSS. Right panel: comparison of [Fe/H] reported by Willett et al. (2009), Li et al. (2018), and Huang et al. (2019). |
| In the text | |
|
Fig. 6 Left panel: metallicity distribution of GD-1 members along the stream, as determined in this work. Right panel: metallicity distribution from previous studies. |
| In the text | |
|
Fig. 7 Left panels: velocity (vgsr) and proper motion distribution of GD-1 members along the stream, as determined in this work. Right panels: velocity (vgsr) and proper motion distribution of GD-1 members along the stream from previous studies. |
| In the text | |
|
Fig. 8 Color-magnitude diagram of Kshir members from Malhan et al. (2019a) and this work. Gray stars far from the isochrone have been removed. Magnitudes were obtained by cross-matching with Gaia DR3. The isochrone is the same as that used for the GD-1 stream. |
| In the text | |
|
Fig. 9 Comparison of the position, proper motion and velocity (vgsr) of the Kshir and GD-1 streams. Kshir members from Malhan et al. (2019a) are also shown in left and middle panels. |
| In the text | |
|
Fig. 10 Comparison of the proper motion (μα, μδ) of the Kshir stream and the GD-1 stream. The uncertainties are indicated by error bars. |
| In the text | |
|
Fig. 11 Velocity dispersion of the GD-1 stream (left) and Kshir stream (middle) along the line-of-sight direction. Right: Velocity dispersion of the GD-1 stream along the tangential direction. The dashed line indicates the 95% confidence level. |
| In the text | |
|
Fig. 12 Color-magnitude diagram of GD-1 giant members. Magnitudes are obtained by cross-matching with Gaia DR3. The isochrone is same as that of the GD-1 stream. |
| In the text | |
|
Fig. 13 Distribution of GD-1 members (dots) in the X–Y, X–Z, and Y–Z planes. Colored arrows indicate the movement direction of GD-1 members, the color shows the value of ϕ1. The black dashed line shows the orbit of the GD-1 stream, and the black arrow indicates the orbit direction (Willett et al. 2009). A red five-pointed star marks the location of ϕ1 = −60°. |
| In the text | |
Current usage metrics show cumulative count of Article Views (full-text article views including HTML views, PDF and ePub downloads, according to the available data) and Abstracts Views on Vision4Press platform.
Data correspond to usage on the plateform after 2015. The current usage metrics is available 48-96 hours after online publication and is updated daily on week days.
Initial download of the metrics may take a while.