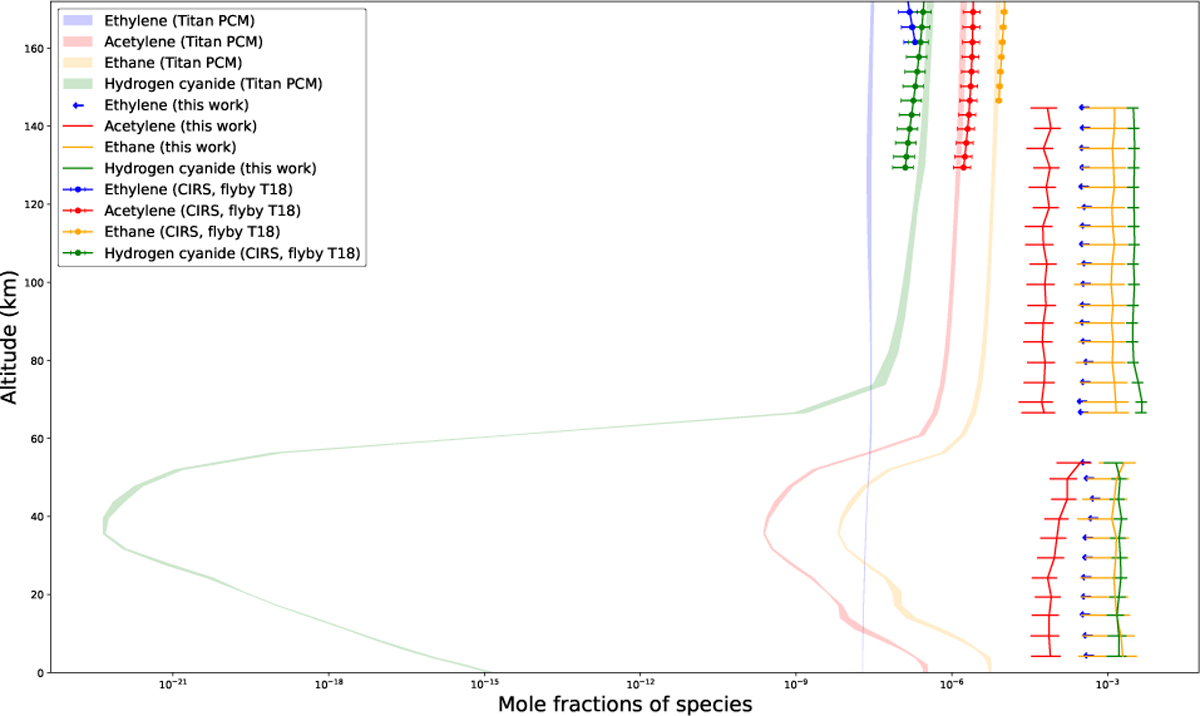
Fig. 4
Download original image
Comparison between the mole fractions of four species calculated using our code (solid lines with 1σ std) and the one calculated using the Titan PCM model (shaded lines) from 0 to 147 km. The error bars in the PCM modeled profiles denote the range of values between Ls 300°-360°. The vertical profiles of HCN, C2H2, and C2H6 from Titan PCM show a decrease in mole fractions after condensation near the tropopause, while C2H4 does not condense in Titan conditions. Mole fractions computed using CIRS data have also been plotted at 150 km (solid lines with circular markers, 1σ std) (Mathé et al. 2020). We took results from flyby T18 for this comparison because it was conducted near the Huygens probe landing site.
Current usage metrics show cumulative count of Article Views (full-text article views including HTML views, PDF and ePub downloads, according to the available data) and Abstracts Views on Vision4Press platform.
Data correspond to usage on the plateform after 2015. The current usage metrics is available 48-96 hours after online publication and is updated daily on week days.
Initial download of the metrics may take a while.