Fig. 10.
Download original image
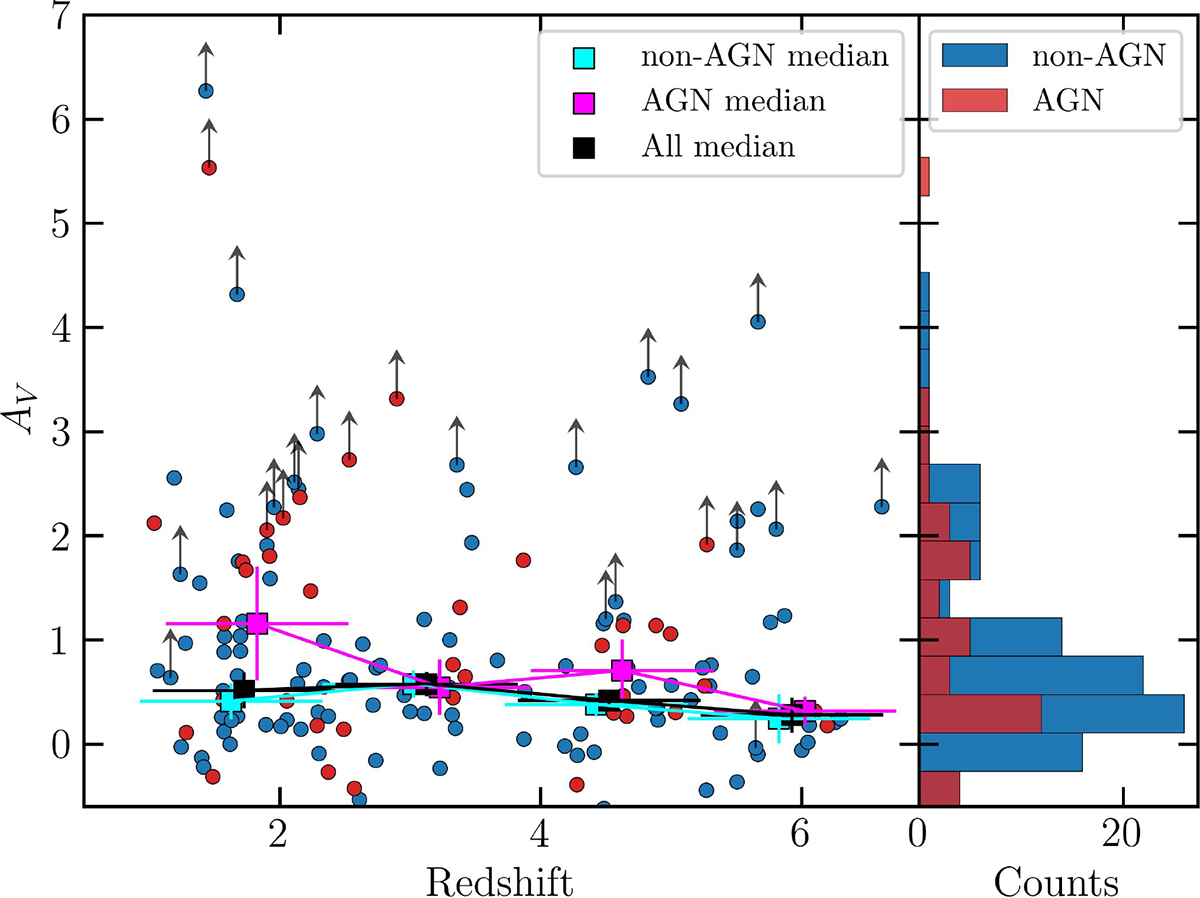
Redshift distribution of the values of AV inferred from the Balmer decrement in sources with detected Hα and Hβ lines. For sources with upper limits on Hβ we derived lower limits on AV. On the left, we also report the median values of AV for NLAGN (magenta), non-AGN (cyan) and for the global population (black) in four different redshift bins. Errors are derived using the bootstrap procedure. On the right, we report the histogram of the AV distribution for AGN (red) and non-AGN (blue).
Current usage metrics show cumulative count of Article Views (full-text article views including HTML views, PDF and ePub downloads, according to the available data) and Abstracts Views on Vision4Press platform.
Data correspond to usage on the plateform after 2015. The current usage metrics is available 48-96 hours after online publication and is updated daily on week days.
Initial download of the metrics may take a while.