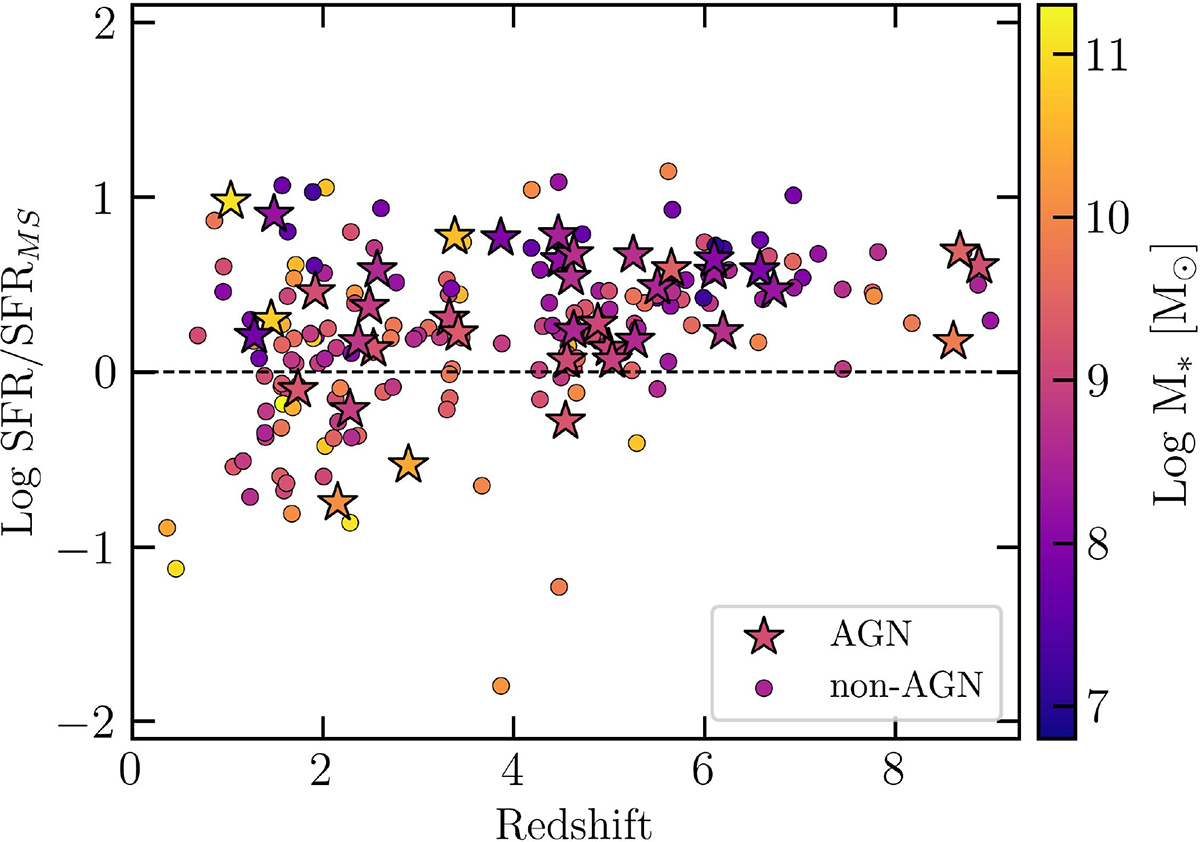
Fig. 12.
Download original image
Redshift distribution of the ratio between the SFR derived from the SED-fitting and the SFR computed from the MS relation derived by Popesso et al. (2023) at the redshift and M* of each source. We plot AGN and non-AGN sources with stars and circles, respectively. The sources are color-coded based on the stellar mass, as derived from the SED-fitting.
Current usage metrics show cumulative count of Article Views (full-text article views including HTML views, PDF and ePub downloads, according to the available data) and Abstracts Views on Vision4Press platform.
Data correspond to usage on the plateform after 2015. The current usage metrics is available 48-96 hours after online publication and is updated daily on week days.
Initial download of the metrics may take a while.