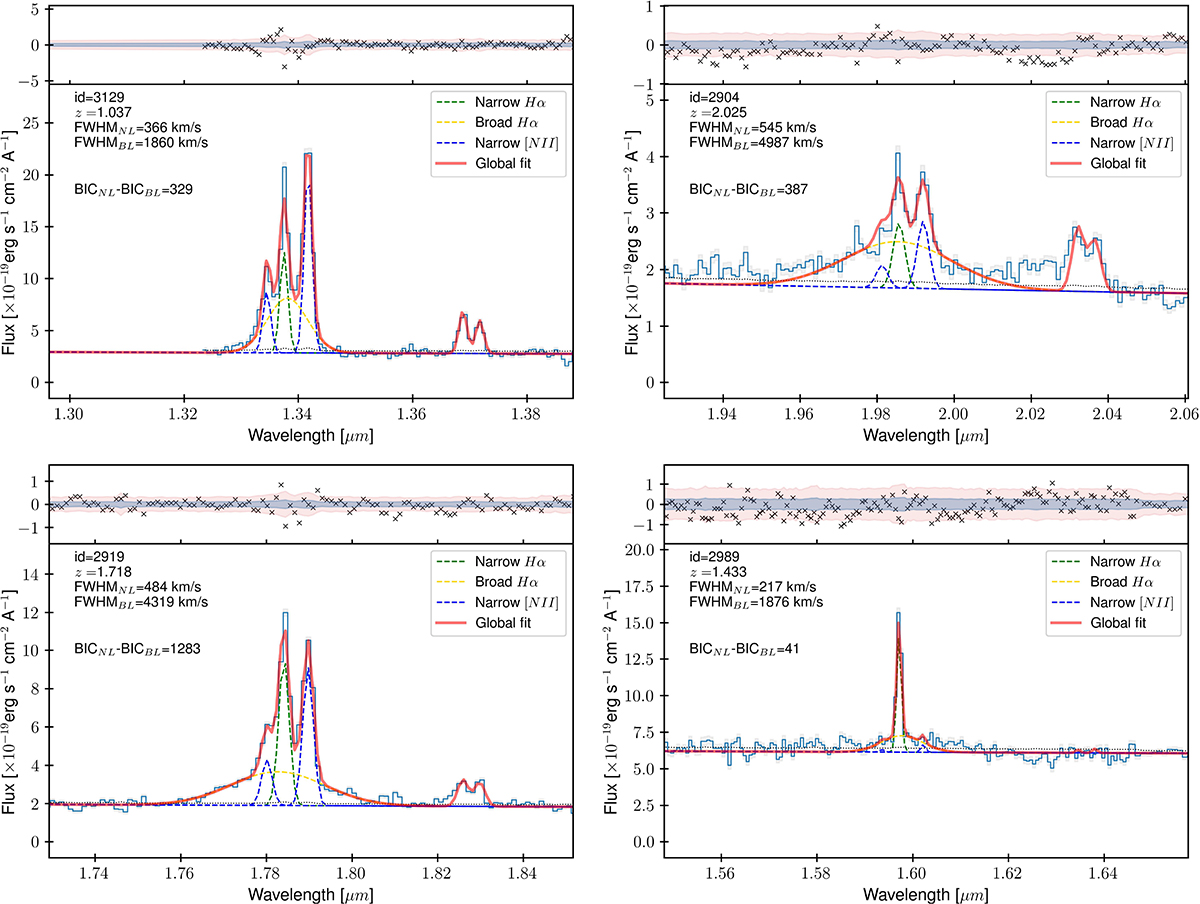
Fig. A.1.
Download original image
Fit of the Hα, [N II], and [S II] complex including both a broad and a narrow components of the Hα emission line, as is described in Sect. 2.2. The global fit is presented in red, while the narrow and broad Hα components are in green and yellow, respectively. The blue line represents the fit of the narrow [N II] doublet. In the upper panel are shown the residuals of the fit compared with the distribution of the 1σ (blue) and 3σ (red) errors on the fluxes. On the upper left part of the plots are reported the id, redshift, FWHMs derived from the fits, and the difference between the BIC value computed from the narrow-only line fit and the one from the fit with the additional broad Hα component
Current usage metrics show cumulative count of Article Views (full-text article views including HTML views, PDF and ePub downloads, according to the available data) and Abstracts Views on Vision4Press platform.
Data correspond to usage on the plateform after 2015. The current usage metrics is available 48-96 hours after online publication and is updated daily on week days.
Initial download of the metrics may take a while.