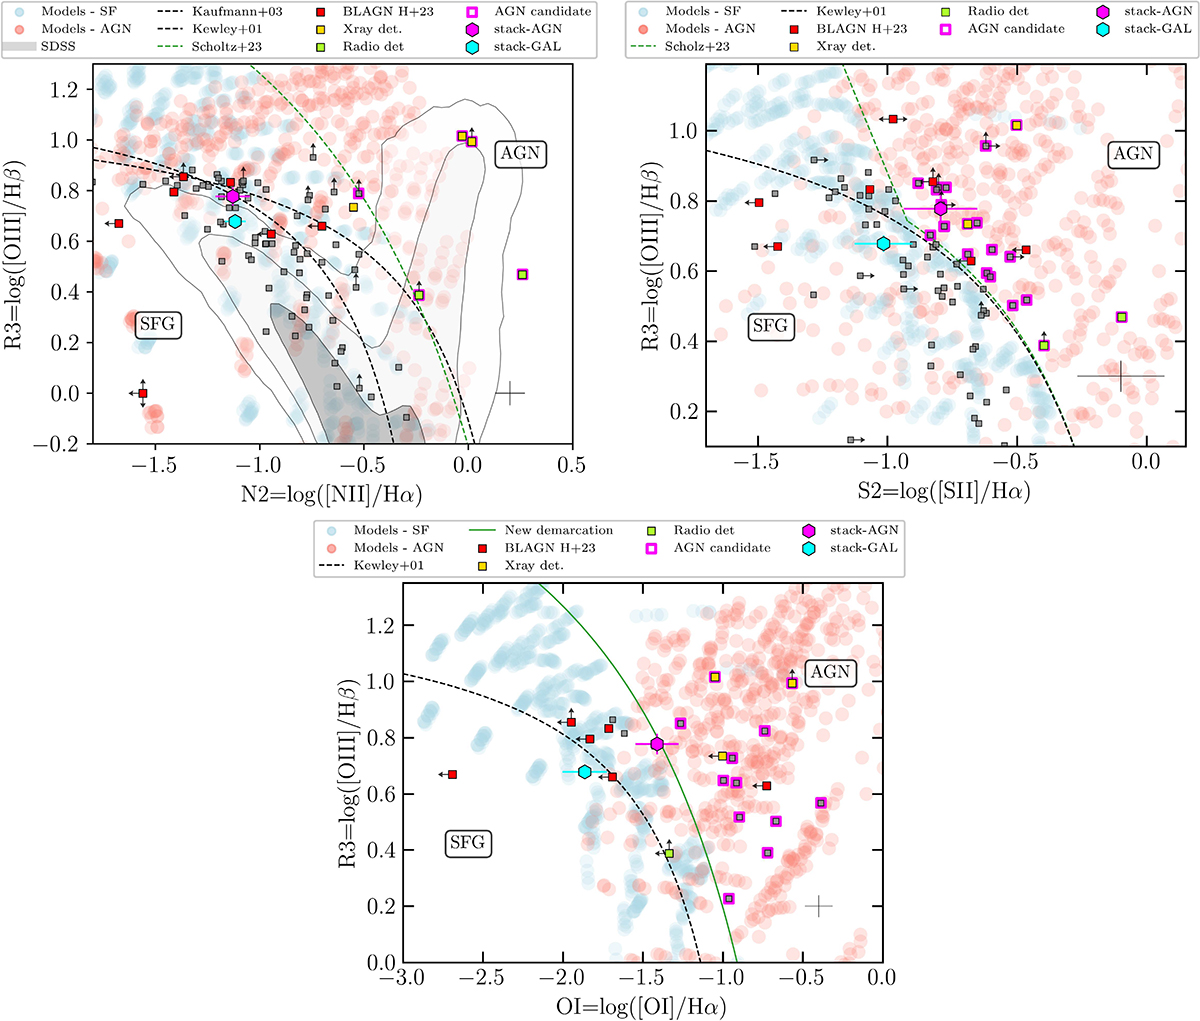
Fig. 2.
Download original image
Left: R3N2 diagnostic diagram (also called BPT). The gray points represent the parent sample of galaxies analyzed in this work. Gold, green and red colors are used, respectively, for X-ray detected sources, radio-detected sources, and the high-z BLAGNs reported in Harikane et al. (2023). The NLAGNs selected using this diagram are marked with magenta edges. In magenta and cyan, we show the line ratios derived from the stacked spectra of all the selected NLAGN (52 sources) and non-AGN sources. The dashed lines refer to three different demarcation lines, as labeled, the one in green is the more conservative demarcation line derived in Scholtz et al. (2025). The shaded blue and red area represents the regions covered by the SFG and AGN photoionization models computed in Gutkin et al. (2016) and Feltre et al. (2016). The gray contours mark the distribution of SDSS sources (taken from SDSS DR7; Abazajian et al. 2009). In the lower-right corner are reported the median errors of the sample. Right: R3S2 diagnostic diagram (also called VO87) with the demarcation line originally presented in Kewley et al. (2001) (in black) and the new (more conservative) demarcation derived in Scholtz et al. (2025). Bottom: R3O1 diagnostic diagram with the demarcation line presented in Kewley et al. (2001) (dashed black line) and the new one derived in this work (solid green line).
Current usage metrics show cumulative count of Article Views (full-text article views including HTML views, PDF and ePub downloads, according to the available data) and Abstracts Views on Vision4Press platform.
Data correspond to usage on the plateform after 2015. The current usage metrics is available 48-96 hours after online publication and is updated daily on week days.
Initial download of the metrics may take a while.