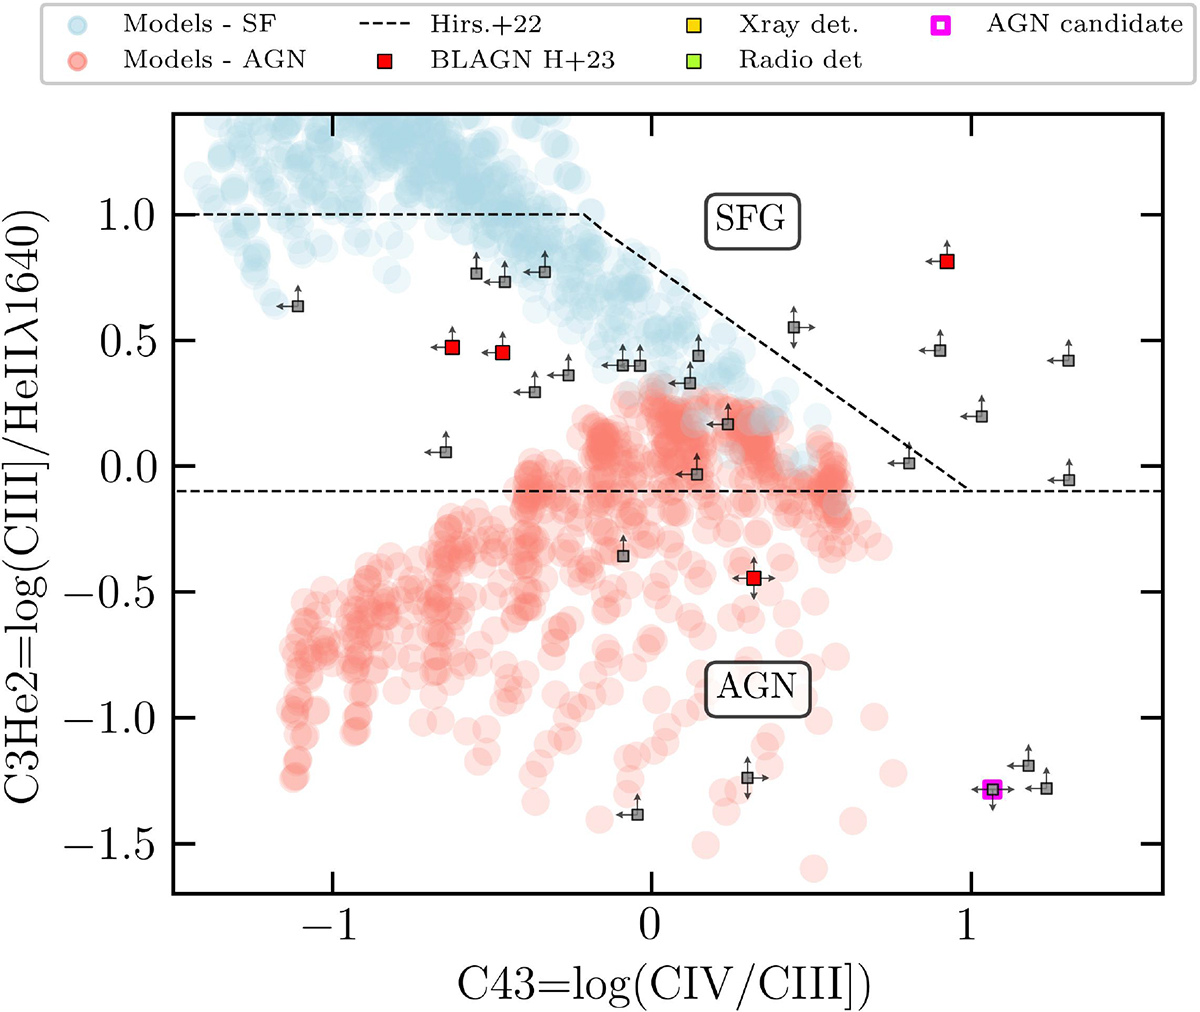
Fig. 5.
Download original image
C3He2 versus C43 diagnostic diagrams, selecting only one NLAGN due to the difficulties in detecting rest-UV lines in high-z galaxies with the short exposure times of the CEERS survey. The stacking line ratios and the average errors are not reported because of the poor statistics. The colors follow the same scheme as in Fig. 2. The demarcation lines are those defined in Hirschmann et al. (2023).
Current usage metrics show cumulative count of Article Views (full-text article views including HTML views, PDF and ePub downloads, according to the available data) and Abstracts Views on Vision4Press platform.
Data correspond to usage on the plateform after 2015. The current usage metrics is available 48-96 hours after online publication and is updated daily on week days.
Initial download of the metrics may take a while.