Fig. 10
Download original image
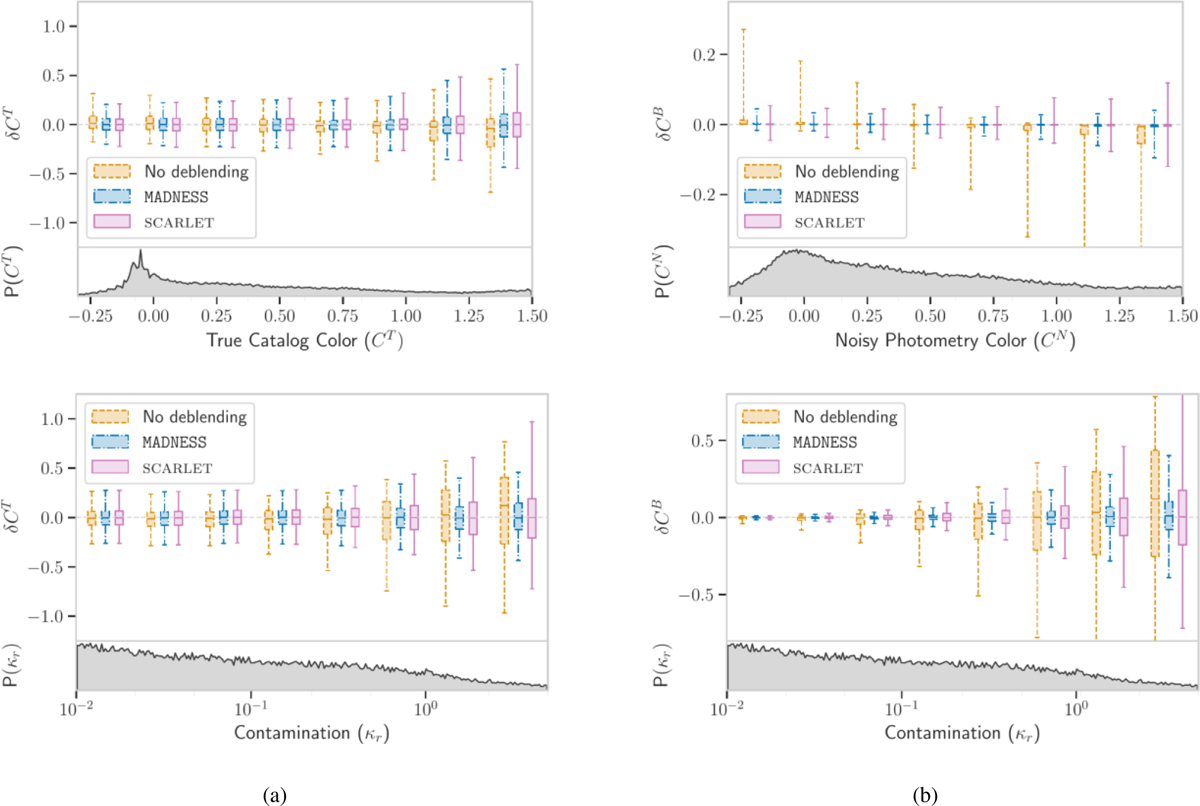
Comparison of the g–r color for galaxies in TestFields for three cases: without deblending, deblending with MADNESS and with SCARLET, as we vary the color (top panels) and contamination, κr, in the r-band (bottom panels). Panel (a) shows the variation of true color residuals (δCT) computed with the color from catalog (CT) as the baseline, and panel (b) shows the distribution of blending error (δCB) with colors from photometry on noisy isolated galaxies (CN) as the baseline. For each panel, the top plot shows the color residuals where the boxes and whiskers in the plot indicate the ranges from 25th to 75th and 5th to 95th percentiles, respectively. The plot at the bottom of each panel shows the distribution of the metric on the horizontal axis.
Current usage metrics show cumulative count of Article Views (full-text article views including HTML views, PDF and ePub downloads, according to the available data) and Abstracts Views on Vision4Press platform.
Data correspond to usage on the plateform after 2015. The current usage metrics is available 48-96 hours after online publication and is updated daily on week days.
Initial download of the metrics may take a while.