Fig. 2
Download original image
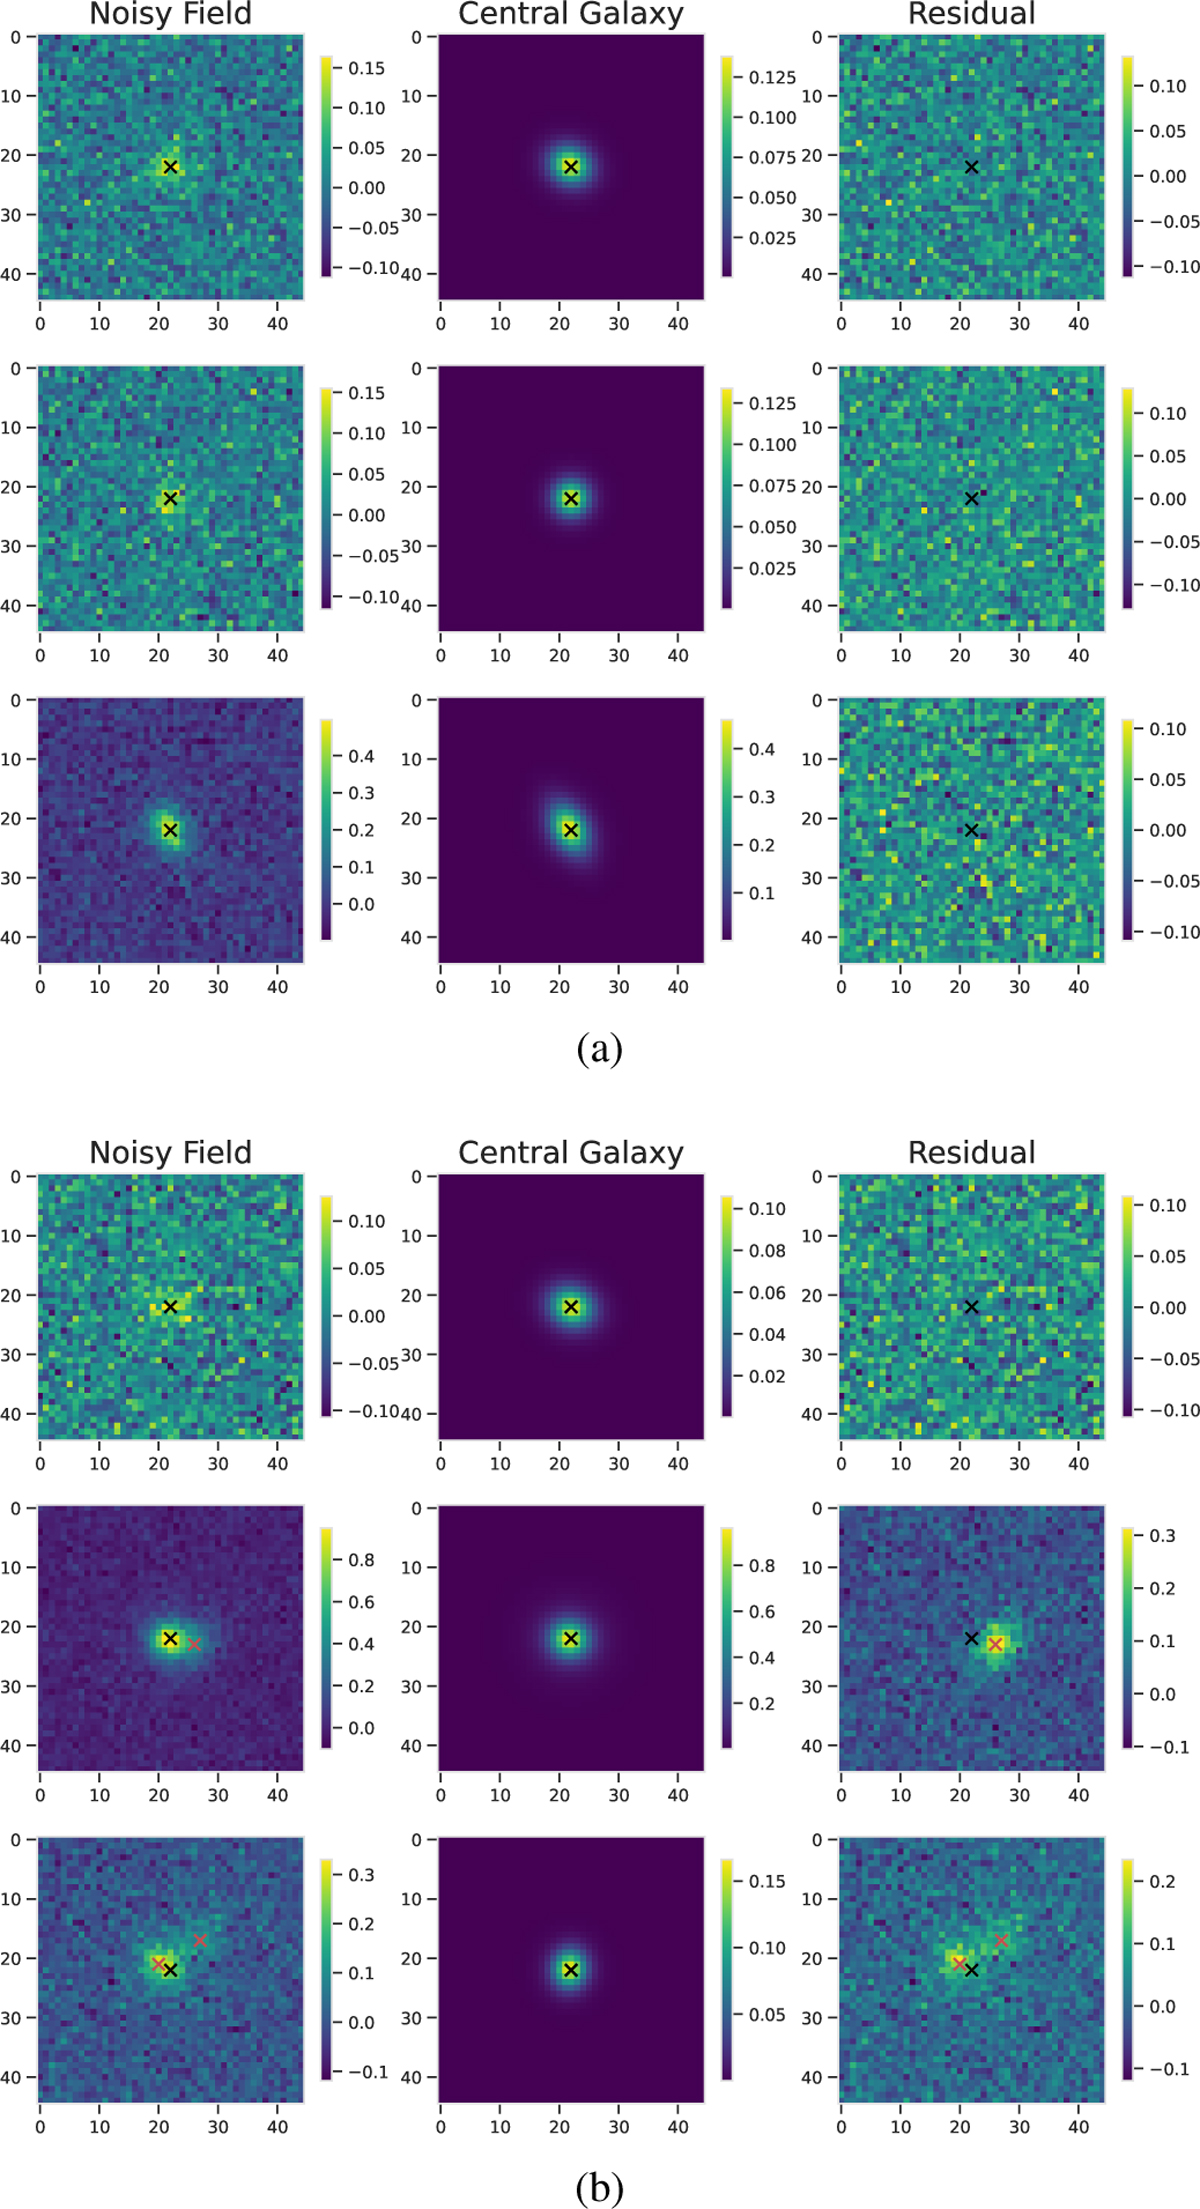
Examples of normalized simulations in the r-band, used for training and validating the variational autoencoder and the normalizing flow. Panel (a) shows galaxies from the IsolatedSims dataset, while panel (b) shows galaxies from the BlendedSims dataset. The central galaxy in the stamps is marked in black while the neighbors in the BlendedSims are marked in red. Each row represents the same scene, and the first column shows the noisy field; the second column shows the isolated noiseless central galaxy; the third column shows the residual field after subtracting the central galaxy from the noisy field. The color bar for each plot shows the normalized electron counts in the pixels.
Current usage metrics show cumulative count of Article Views (full-text article views including HTML views, PDF and ePub downloads, according to the available data) and Abstracts Views on Vision4Press platform.
Data correspond to usage on the plateform after 2015. The current usage metrics is available 48-96 hours after online publication and is updated daily on week days.
Initial download of the metrics may take a while.