Open Access
Fig. 3
Download original image
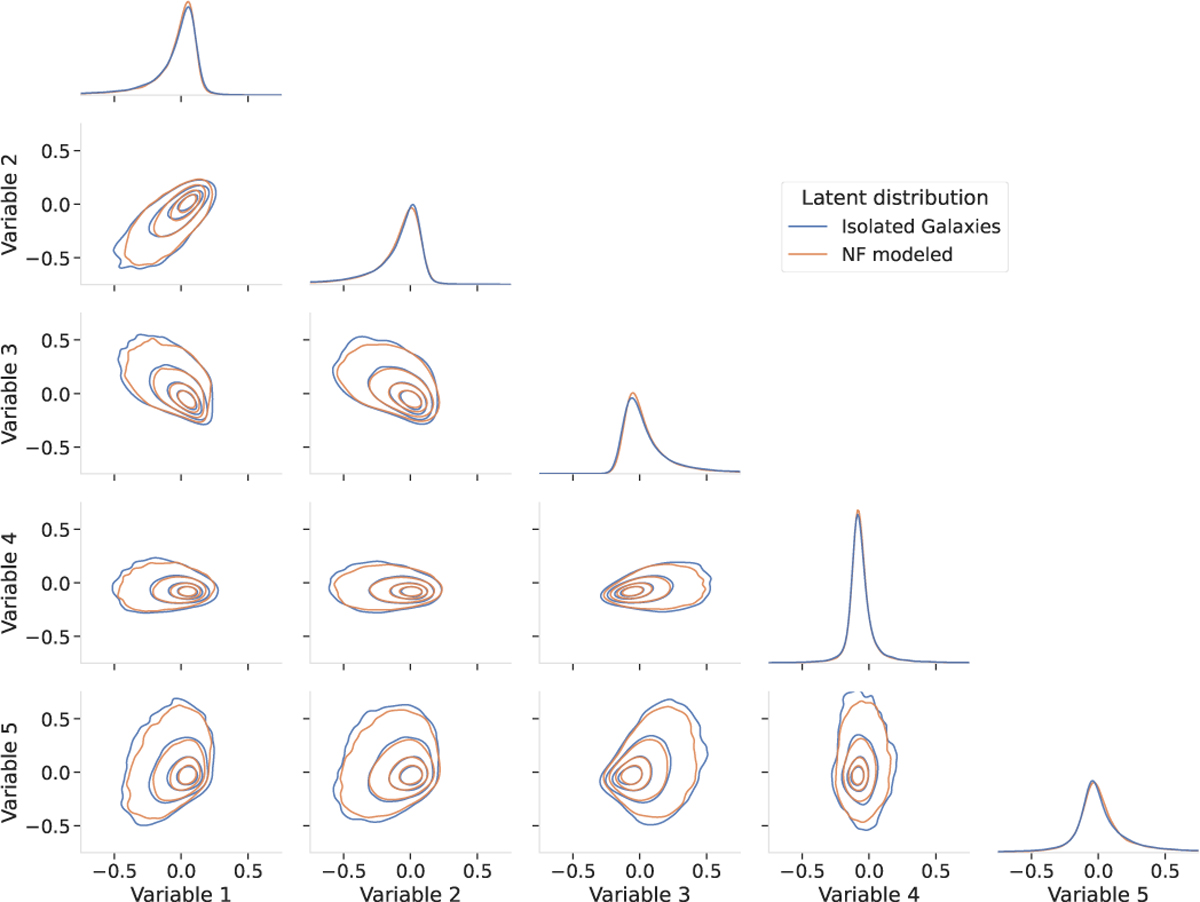
Comparison of the latent space distribution of 50 000 samples each from the validation set of IsolatedSims and the distribution learned by the normalizing flow. As one moves out from the center of the distribution, the contours represent 25%, 50%, 75%, and 90% of the probability mass.
Current usage metrics show cumulative count of Article Views (full-text article views including HTML views, PDF and ePub downloads, according to the available data) and Abstracts Views on Vision4Press platform.
Data correspond to usage on the plateform after 2015. The current usage metrics is available 48-96 hours after online publication and is updated daily on week days.
Initial download of the metrics may take a while.