Fig. 6
Download original image
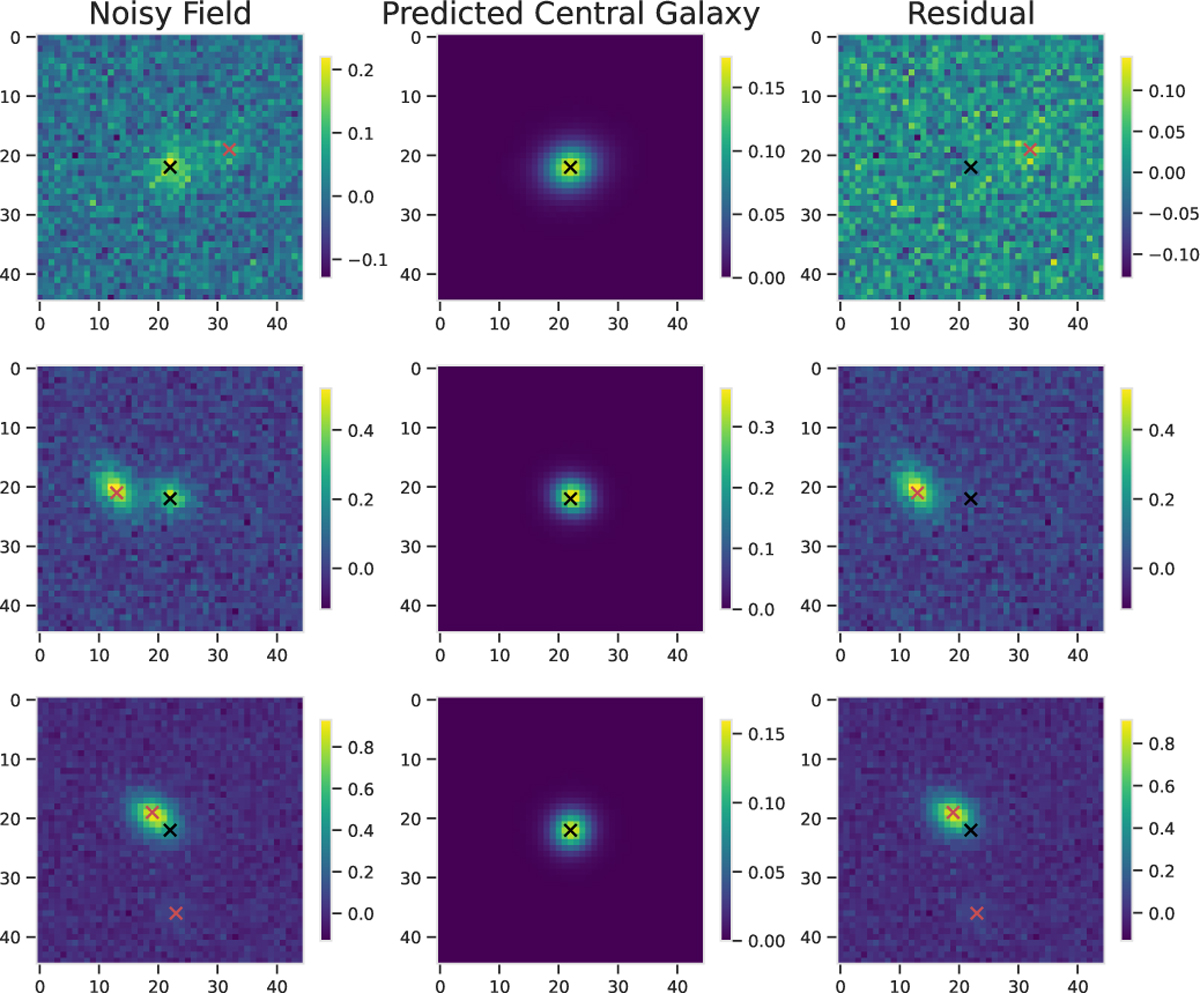
Examples of deblended central galaxies from the validation set of BlendedSims, predicted in the r-band by a single forward pass through the VAE-deblender. Each row represents the same scene and the first column shows the blended scene; the second column shows the predicted model for the central galaxy; and the third column is the result of subtracting the predicted model from the blended field. The color bar for each plot shows the normalized electron counts in the pixels.
Current usage metrics show cumulative count of Article Views (full-text article views including HTML views, PDF and ePub downloads, according to the available data) and Abstracts Views on Vision4Press platform.
Data correspond to usage on the plateform after 2015. The current usage metrics is available 48-96 hours after online publication and is updated daily on week days.
Initial download of the metrics may take a while.