Fig. 9
Download original image
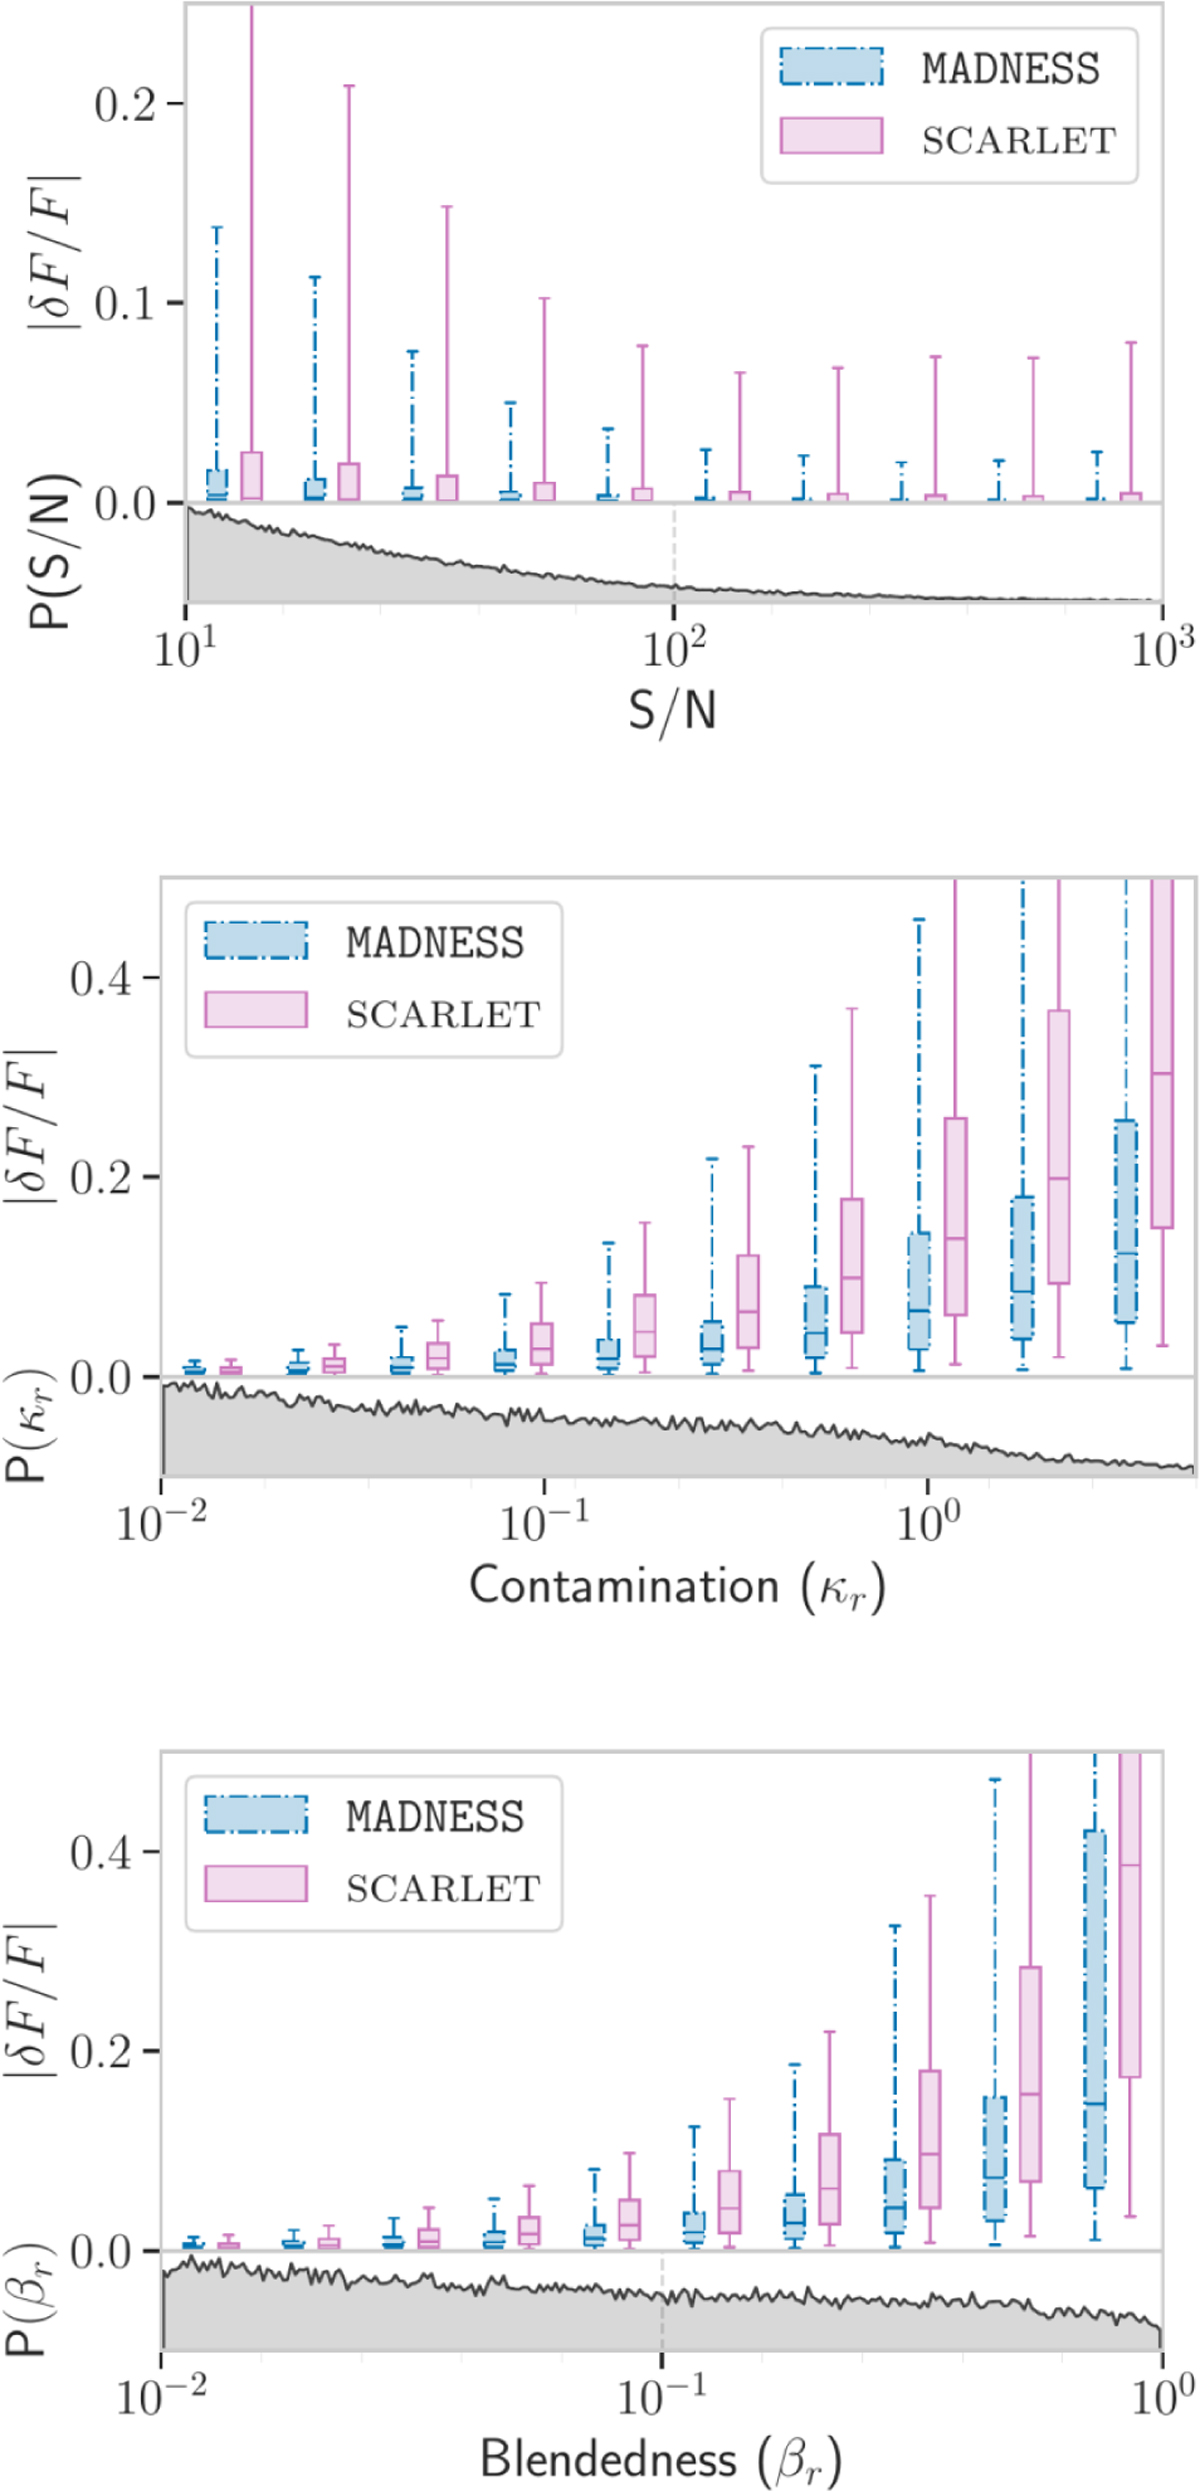
Aperture-photometry results in the r-band of galaxies from TestFields after deblending with MADNESS, SCARLET, in terms of signal-to-noise ratio (S/N), blendedness (β), and contamination (κ) in the r-band. In each panel, the top plot shows the distribution of the absolute value of relative flux residual (∣δ F/F∣) while the bottom plot shows the distribution of galaxies for the metric on the x-axis. The boxes in the plot on top show the range from the 25th to 75th percentile, with a horizontal line representing the median, while the whiskers represent the 5th to 95th percentile of relative residuals in the r-band.
Current usage metrics show cumulative count of Article Views (full-text article views including HTML views, PDF and ePub downloads, according to the available data) and Abstracts Views on Vision4Press platform.
Data correspond to usage on the plateform after 2015. The current usage metrics is available 48-96 hours after online publication and is updated daily on week days.
Initial download of the metrics may take a while.