| Issue |
A&A
Volume 700, August 2025
|
|
|---|---|---|
| Article Number | A153 | |
| Number of page(s) | 11 | |
| Section | Interstellar and circumstellar matter | |
| DOI | https://doi.org/10.1051/0004-6361/202452160 | |
| Published online | 14 August 2025 | |
Detection of circumstellar disks around nearby young brown dwarf candidates
1
Department of Physics, International University,
Ho Chi Minh City,
Vietnam
2
Vietnam National University,
Ho Chi Minh City,
Vietnam
3
Research School of Astronomy and Astrophysics, Australian National University,
Cotter Rd,
Weston,
ACT 2611,
Australia
4
Instituto de Astrofísica de Canarias,
Spain
★ Corresponding author: This email address is being protected from spambots. You need JavaScript enabled to view it.
Received:
6
September
2024
Accepted:
12
July
2025
Abstract
Context. It is important to detect and study circumstellar disks around late-M and brown dwarfs of nearby young associations to understand how these very low-mass objects form and how rocky planets form around them. The detection of new very low-mass members of nearby young associations will also significantly improve our current understanding of young associations.
Aims. We searched for new young very low-mass members with circumstellar disks in a sample of 3928 candidates.
Methods. We constructed spectral energy distributions of all candidates using observational photometric data from DENIS, 2MASS, and WISE and trigonometric parallaxes from Gaia to detect infrared excess emission that indicates the presence of circumstellar disks. We then followed up spectroscopic observations of candidates to search for lithium to confirm their youth. The Hα emission line was used to detect accretion.
Results. We detected 23 among the 3928 candidates with circumstellar disks: Ten objects are new, and 13 were previously reported in the literature. Our mass estimates also indicate that 21 are brown dwarf candidates and 2 are very low-mass stars. DENIS J0534552–104808 has a Gaia distance of 238 pc and might be the first brown dwarf candidate member of a foreground population in front of the Orion D cloud. This foreground population is probably associated with the supergiant κ Ori. Based on our spectroscopic observations, we detected lithium in 11 candidates. We also identified seven accretors and one potential accretor. The intense long-lived accretion detected in DENIS-P J0500245–333042, a 20 Myr old brown dwarf candidate may be additional evidence to favor the formation of rocky planets around very low-mass objects.
Key words: techniques: photometric / techniques: spectroscopic / brown dwarfs / circumstellar matter / stars: formation
© The Authors 2025
 Open Access article, published by EDP Sciences, under the terms of the Creative Commons Attribution License (https://creativecommons.org/licenses/by/4.0), which permits unrestricted use, distribution, and reproduction in any medium, provided the original work is properly cited.
This article is published in open access under the Subscribe to Open model. This email address is being protected from spambots. You need JavaScript enabled to view it. to support open access publication.
1 Introduction
Late-M and brown dwarf (BD) populations in nearby young associations at different ages offer us excellent opportunities to study the formation mechanism of these very low-mass (VLM) objects and the planet formation around them. The search for VLM BDs close to the BD-planet boundary has also led to the discovery of planetary mass objects (Zapatero Osorio et al. 2000; Martín et al. 2025) that challenge our understanding of the formation mechanism of free-floating planets.
The Gaia DR3 archive (Gaia Collaboration 2023) contains about 1.8 billion sources with high-precision proper motions and trigonometric parallaxes. With a limiting magnitude of about 20.7 in G band, Gaia can detect an M5.5 dwarf with a G-band absolute magnitude of MG = 12.25 (Cifuentes et al. 2020) at ~490 pc and an M8.0 with MG = 15.19 at ~127 pc. Proper motions and parallaxes are a key piece in identifying new members of nearby young associations. Therefore, Gaia data are an invaluable resource to study VLM populations in nearby young associations (e.g., Gagné & Faherty 2018; Sarro et al. 2023).
Based on photometric and/or spectroscopic distances, thousands of late-M dwarfs have been identified in the past decades as nearby (≤ 30 pc) VLM stars in the field (e.g., Phan-Bao et al. 2001, 2003, 2008a; Cruz & Reid 2002; Reid et al. 2003; Martín et al. 2010). Many of them are in fact young VLM stars and BDs of nearby young associations, however. The misidentification of these late-M dwarfs is due to the lack of constraints on the age, such as the presence of lithium and trigonometric parallaxes. In our previous search for young BD candidates in a sample of 85 nearby late-M dwarfs (M5.0–M9.0), which were originally identified over 5700 square degrees in the Deep Near Infrared Survey of the Southern Sky (DENIS) database with photometric distances ≤ 30 pc, we discovered four new young BD candidates and one new young VLM star in Tucana-Horologium, Columba, β Pic, and Upper Scorpius (Phan-Bao et al. 2017; Nguyen-Thanh et al. 2020). One of them, a young BD (DENIS-P J1538317–103850), shows sporadic and intense accretion. The detections imply that nearby field late-M dwarfs identified in the DENIS database may in fact be young BD members of nearby young associations. Following the previous detections, we expanded our search to the entire DENIS database over 13 500 square degrees at high Galactic latitude to identify new young BDs with circumstellar disks.
We present our sample in Sect. 2. The detection of new BD candidates and VLM stars in nearby young associations and spectroscopic follow-up is presented in Sect. 3. We summarize our results in Sect. 4.
2 Sample
In our previous paper (Nguyen-Thanh et al. 2020), we presented our search for circumstellar disks around 85 nearby late-M dwarfs. These nearby late-M dwarfs were previously identified over 5700 square degrees in the DENIS database at high Galactic latitude with |b| ≥ 30° and photometric distances dphot ≤ 30 pc. The photometric distances were estimated using the I – J versus MI relation for old M dwarfs with known trigonometric parallaxes as given in Phan-Bao et al. (2003).
In this paper, we expanded our search to the entire DENIS database of over about 13 500 square degrees, down to lower Galactic latitude with |b| ≥ 15°. For this search, we focused on distant late-M dwarf candidates with dphot > 30 pc. The photometric distances were estimated using the same I – J versus MI relation as for the previous search. Our sample consisted of 3928 late-M dwarf candidates with a DENIS color in the range of 2.0 ≤ I – J < 3.0 (~M5–M8.5; Phan-Bao & Bessell 2006). We then cross-identified these candidates in the 2MASS (Skrutskie et al. 2006) and AllWISE (Cutri et al. 2014) catalogs. The cross-identification resulted in 3515 candidates for which mid-infrared photometric data are available in WISE.
We followed the same method as in the previous search for infrared (IR) excesses in late-M dwarfs (see also Nguyen-Thanh et al. 2020). With photometric data from DENIS I-band magnitude, 2MASS J, H, and KS-band magnitudes, and WISE W1, W2, W3, and W4-band magnitudes, we constructed the spectral energy distribution (SED) of all 3515 candidates. We converted magnitudes into fluxes using zero-magnitude flux values for DENIS (Fouqué et al. 2000), 2MASS (Cohen et al. 2003), and WISE (Wright et al. 2010). We then used the BT-Settl model atmospheres with solar metallicity and surface gravities log ɡ from 3.0 to 5.5 (Allard et al. 2013) to determine the best fits of the models to the observational data. Distances derived from trigonometric parallaxes were used if available in Gaia (Gaia Collaboration 2016, 2023). We selected any candidates with observed WISE IR fluxes higher than 3σ above the BT-Settl model fluxes, where σ is the error on the observed fluxes. In total, 160 candidates matched our selection criterion. We then further examined the candidates visually in all four WISE band images1. Thirty-seven duplicate sources were removed. The W3 and W4-band fluxes of a source are reliable if the source is clearly visible in the images of these bands. After our visual inspection of the WISE images of all 160 candidates, we finally had 23 candidates with a reliable detection of an IR excess. We also examined the possibility that W3 and W4-band fluxes are contaminated by background objects using SERC2 and 2MASS3 images. No contaminant was found within the largest aperture of 16.″5 (W4) of the four WISE bands.
DENIS and 2MASS photometric data of 23 M dwarfs with IR excess.
3 Results and discussion
Tables 1 and 2 list the DENIS, 2MASS, and WISE photometric data and the Gaia trigonometric parallaxes and proper motions of these 23 candidates. Three candidates lack Gaia proper motions: DENIS0516–0224, DENIS0524–0437, and DENIS1406–4151. We then measured the proper motion of these three candidates based on the plates from the Digital Sky Survey (DSS) server, DENIS and 2MASS positions as described in Phan-Bao et al. (2001). The time baselines span from 6 to 48 yr. Our measurements are included in Table 2. Using these available data and the BT-Settl CIFIST 2011–2015 models (Baraffe et al. 2015), we then determined the mass and age of the candidates and their membership in young associations.
We also followed-up low-resolution spectroscopic observations of 11 candidates to determine their spectral types, and we searched for the Li I absorption line at 6708 Å to confirm their youth. Six of these 11 candidates were spectroscopically observed with medium resolution to search for the presence of accretion. We present our results in the following sections.
WISE photometric and Gaia data of 23 M dwarfs.
3.1 Determination of age, mass, and membership in young associations
To determine the age and mass of a candidate, we used the Gaia trigonometric distance and 2MASS J-band magnitude to derive the J-band absolute magnitude of the candidate. Using the 2MASS J-band absolute magnitude and the IDENIS – J2MASS (hereafter I – J) color, we estimated the age from the closest isochrone of the BT-Settl CIFIST 2011–2015 models to the location of the candidate in the (MJ, I – J) diagram. Figure 1 shows the J-band absolute magnitude versus I – J color diagram for all 23 candidates with isochrones and mass tracks of the models. With the models for the estimated age, we then used the J-band absolute magnitude and its error to determine the mass of the candidate and the uncertainty on the estimated mass, respectively. Table 3 shows our estimates of age, mass, and mass uncertainty. When the error of the I – J color is taken into account, the mass uncertainty is significantly larger than the listed value. For DENIS0516–0224, DENIS0524–0437, and DENIS1406–4151, no Gaia trigonometric parallaxes are available. We assumed that DENIS0516–0224 and DENIS0524–0437 are in Orion D (OriD) and DENIS1406–4151 in Upper Centaurus-Lupus (UCL), as discussed concerning their membership in young associations below, and we then used average distances of 350±3 pc for OriD (Kounkel et al. 2018) and 130±20 pc for UCL (e.g., see Gagné et al. 2018 and references therein) to estimate the ages and masses of these three objects. Our estimates indicate that the masses of 21 candidates are below the substellar mass, and the objects are therefore BD candidates. The masses for 2 of them are above 75 MJup, and they are VLM stars. Figure 1 also shows that according to the BT-Settl CIFIST 2011–2015 models, lithium is still present and detectable in the stellar atmospheres of all 23 candidates.
For each candidate, we also modeled a blackbody to estimate the disk mass Mdisk, the disk temperature Tdisk, and the fractional IR luminosity f = LIR/L★. The DENIS I-band, 2MASS J, H, and KS-band, and WISE W 1-band fluxes were used to find the best-fit BT-Settl stellar atmosphere models. The results indicate low surface gravities log ɡ from 3.0 to 4.5 in all candidates. Most of our candidates only show IR excesses in WISE W3 and W4-bands where the disk emission predominates in comparison to the stellar emission. We therefore only used the WISE W3 and W4-band fluxes to model the disk. Table 3 lists the results for the 23 candidates. The best fits of the disk blackbody modeling to the photometric data are shown in Figure A.1. The SEDs of DENIS0534–1048, DENIS1334–4619, DENIS1448–3859, DENIS1506–3414, and DENIS1546–2556 fit the W1 and W2 data points poorly. The poor fits may indicate that there is both a hot inner and a cold outer disk component. This requires a fit with two blackbodies at different temperatures, as discussed in Morales-Gutiérrez et al. (2021). At this point, a further detailed analysis of the disk structure of these objects is needed. The fractional IR luminosity f of all our candidates lies above the boundary of f ~ 0.01 between the debris and protoplanetary disks (Hughes et al. 2018; Sgro & Song 2021), indicating that all the 23 candidates harbor protoplanetary disks.
Ten of these detections of protoplanetary disks are new, and 13 were previously reported in the literature (see Table 3).
To determine the membership of these 23 candidates in young associations, we used the Bayesian analysis tool BANYAN Σ4 for candidates within about 150 pc (Gagné et al. 2018). We also searched VizieR and SIMBAD for previously identified members of young associations in the literature. There are 5 new candidate members and 18 previously reported ones of young associations. Our identification of the 18 known members based on the membership probability values agree with the literature, except for DENIS0338–3334, DENIS0338–2646, DENIS0844–7833, and DENIS0856–1342. The results based on the BANYAN tool imply that these 4 candidates are field objects. The membership probabilities for the field are 51.1%, 99.9%, 61.2%, and 95.8% for DENIS0338–3334, DENIS0338–2646, DENIS0844–7833, and DENIS0856–1342, respectively. In contrast to the results from the BANYAN tool, the membership probabilities from the literature (see Table 3), however, imply that DENIS0338–3334 (Cantat-Gaudin et al. 2018) and DENIS0338–2646 (Galli et al. 2021) are members of χ1 Fornacis (XFor), and DENIS0844–7833 (Cantat-Gaudin et al. 2018) is a member of η Chamaeleon (η Cha). Our detections of lithium and strong Hα emission in these 3 objects (see Sect. 3.2 for further details) strongly support their youth. We therefore adopted their membership in young associations from the literature. For the case of DENIS0856–1342, our revised membership probability of this object in TW Hydrae (TWA) with Gaia parallax and proper motion is low, only 2.1%. This is consistent with the value of 4.9% estimated by Gagné et al. (2015). Its optical (Cooper et al. 2024) and near-IR (Gagné et al. 2015) spectra have exhibited signs of a low-gravity M8 dwarf, which supports its youth. As discussed by Boucher et al. (2016), DENIS0856–1342 might be a member of another young association that is not yet included in BANYAN. This results in a low membership probability in TWA.
We used the Vizier tool for the five new candidate members, three of which lack Gaia parallaxes (DENIS0516–0224, DENIS0524–0437, and DENIS1406–4151) and two of which lie at distances greater than 150 pc (DENIS0521–0802 and DENIS0534–1048)5, which uses the constellation boundaries given by Roman (1987) to provide the constellation in which each candidate is located. We found that DENIS0516–0224, DENIS0524–0437, DENIS0521–0802, and DENIS0534–1048 are located in the region of Orion (Ori) and DENIS1406–4151 lies in the region of Centaurus (Cen). This suggests that these five M dwarfs are new candidate members of the young associations. Further measurements of radial velocity and/or parallax of the M dwarfs are needed to confirm their membership. Our results are listed in Table 3.
The VLM star DENIS0521–0802 (83 MJup) lies at a Gaia distance of 365 pc, which is consistent with an average distance of 350±3 pc to subregions of the OriD cloud (see Kounkel et al. 2018). In DENIS0534–1048 (74 MJup, 1 Myr), however, the BD candidate is located at 238 pc toward the OriD cloud, but much closer than OriD. This implies that DENIS0534–1048 might be a member of a foreground population in front of OriD (hereafter, OriD-foreground). The distance to DENIS0534–1048 is comparable to the Hipparcos distance, ~221±38 pc to the supergiant κ Ori (Pillitteri et al. 2016). DENIS0534–1048 has a Gaia proper motion with μRA = 2.511 ± 0.289 mas yr–1 and μDE = –4.320 ± 0.264 mas yr–1. These Gaia proper motion values are comparable to those of κ Ori as measured by Hipparcos with μRA = 1.55 ± 0.67 mas yr–1 and μDE = –1.20 ± 0.50 mas yr–1. The small difference between the proper motion values of these two objects may be interpreted as a spread in velocities as seen in any association. The location of the BD candidate is about 3.4° from κ Ori. This suggests that the OriD-foreground population may be associated with κ Ori. Further studies are needed to clarify the membership of DENIS0534–1048 and to confirm the existence of the OriD-foreground population.
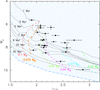 |
Fig. 1 2MASS J-band absolute magnitude vs. I – J color diagram for 23 candidates with available Gaia parallaxes. The DENIS I-band and 2MASS J-band photometric data are listed in Table 1. Isochrones and mass tracks from the BT-Settl CIFIST 2011–2015 models (Baraffe et al. 2015) are plotted. The hatched blue area indicates the region in which lithium is not completely depleted and can be detected in the stellar atmosphere. |
Star and disk properties and membership in young associations of the 23 BD candidates and VLM stars.
Hα, Li I 6708 Å, and Na I (8170–8200 Å) EWs, spectral indices and spectral types estimated from the R3000 spectra for 11 young BD candidates and VLM stars.
3.2 Spectroscopic follow-up observations
We observed 11 of the 23 candidates with the Wide Field Spectrograph (WiFeS; Dopita et al. 2007) on the ANU 2.3 m telescope at Siding Spring Observatory. We used the R3000 grating over 5300–9700 Å with a pixel size of 1.25 Å and a resolution of R ≈ 3000. The signal-to-noise ratios per pixel of the R3000 spectra are in the range of 7–11. We additionally observed 6 of the 11 candidates with the R7000 grating over a wavelength range of 5300–7050 Å and a pixel size of 0.44 Å, providing a spectral resolution of R ≈ 7000. The signal-to-noise ratios per pixel of the R7000 spectra are in the range of 7–12. Tables 4 and 5 list the observing dates of the candidates.
We then used FIGARO (Shortridge et al. 2004) for the data reduction. The spectra were corrected for telluric absorption. Smooth spectrum stars were additionally observed to remove the telluric lines (see Bessell 1999). A NeAr arc was used for the wavelength calibration.
The R3000 spectra of the 11 M dwarfs are shown in Figure 2. Their spectral types are estimated from three indices VOa, TiO5, and PC3, as described in Phan-Bao et al. (2017); Phan-Bao & Bessell (2006). The adopted spectral type (Table 4) is an average value calculated from the three spectral indices. The estimated spectral types of these candidates are in the range from M4.5 to M6.0. Their I - J colors in the range of 1.91–2.45 also agree with the unreddened I - J colors of ~ 1.9–2.3 of young M4.5–M6 dwarfs (see Luhman & Steeghs 2004 and references therein) within the error bars. This consistency implies that the reddening effect is not significant for these M dwarfs. Therefore, we did not consider the dereddening of SEDs of the 11 M dwarfs or the 12 remaining candidates.
All observed 11 M dwarfs indicate the Li I line at 6708 Å in the R3000 spectra (Fig. 3), implying the youth of these M dwarfs.
The lithium search for 10 of them is reported for the first time here, and one has previously been reported in the literature (see Table 4). We measured equivalent widths (EW) of the Li I line using the IRAF task plot, as described in the previous papers (Phan-Bao et al. 2017; Nguyen-Thanh et al. 2020). For each spectrum, we visually determined the continuum levels and integration limits. We estimated the EW uncertainties by measuring EWs with different possible continuum levels and calculating the expected uncertainty from Cayrel’s formula Cayrel (1988). Our R7000 spectra of the six M dwarfs (Table 5) also show lithium (Fig. 4), confirming the lithium presence in the R3000 spectra of these six M dwarfs. For DENIS0844–7833, the previously reported detections of lithium with EW measurements of 0.48 Å (Song et al. 2004) and 0.536 Å (Schneider et al. 2019) are consistent with our value of 0.6±0.3 Å. In addition, we also observed DENIS0524–0437 on December 3, 2023 at the Isaac Newton Telescope (INT) with the R600R grating over 4502–8916 Å, corresponding to a spectral resolution of R ≈ 3400. The Li I EW measured in the R600R INT spectrum is 0.4±0.2 Å. Our lithium detection in the R7000 spectra is consistent with the predictions of BT-Settl models based on the Gaia parallaxes and the I – J color (see Fig. 1), as discussed in Sect. 3.1.
Strong Ηα emission is also detected in all M dwarfs (Fig. 2), which further supports their youth. Using the same method as applied to the EW measurement of lithium, we also measured the EWs of Ηα emission. Table 4 lists our measurements. Figure 5 shows the Ηα emission in DENIS0524–0437 observed with the ANU and INT telescopes. The Ηα EWs measured in the ANU and INT spectra are –33 ± 4 Å and –18 ± 1 Å, respectively. The change in Ηα EW implies an accretion process in DENIS0524–0437.
As discussed in Sect. 3.1, the best-fit BT-Settl models to the photometric data results in low surface gravities log ɡ in the range of 3.0–4.5 for all 23 candidates and in the range of 3.5–4.5 for 11 M dwarfs with observed spectra (Table 3). In young M dwarfs, the Na I doublet at 8183 Å and 8199 Å is an indicator of surface gravity (Martín et al. 1996; Lyo et al. 2004; Schlieder et al. 2012; Phan-Bao et al. 2017; Nguyen-Thanh et al. 2020). We thus measured the EWs of the Na I doublet over the range of 8170–8200 Å and their associated uncertainties as described by Martín et al. (2010) and Phan-Bao et al. (2017). Our measurements show that all 11 M dwarfs have weak Na I (Table 4), which agrees well with the modeling results of low surface gravities log ɡ. The values of Na I EWs of the young BD candidates in this paper are also comparable with the Na I EW measured in the young BD, DENIS-P J1538317–103850 with a detected sporadic and intense accretion disk (Nguyen-Thanh et al. 2020).
The spectra of all 11 young M dwarfs show strong Ηα emission. They are thus potential accretors. The Ηα emission profile was used to distinguish between accretors and nonaccretors (Martín 1998; Barrado y Navascués & Martín 2003; Jayawardhana et al. 2003; White & Basri 2003). For spectra with a moderate signal-to-noise ratio and a low resolution of young stars and BDs, Barrado y Navascués & Martín (2003) showed that the EW values of Ηα emission can be used to detect accretion. For our low-resolution R3000 spectra of the 11 candidates, we therefore used the criterion of Ηα EW versus spectral type as given in Barrado y Navascués & Martín (2003) (see their Table 1) to identify accretors. Our observational results are listed in Table 4, and five of them are accretors: DENIS0500–3330 (M6.0), DENIS0516–0224 (M5.0), DENIS0524–0437 (M4.5), DENIS0534–1048 (M5.5), and DENIS0844–7833 (M5.5). DENIS1856–3655 with a spectral type of M5.5 and an Ηα EW of –23±2 Å is a potential accretor because its Ηα EW value is close to the limit value of 24.1 Å (Table 1, Barrado y Navascués & Martín 2003) for an M6.
Since medium- and high-resolution spectroscopic observations of the Hα emission profile can be used to distinguish between accretors and nonaccretors and also to measure the accretion rate (Jayawardhana et al. 2003; White & Basri 2003), we also used our R7000 spectra to identify accretors and measure the accretion rate. We measured the velocity width υ10 of the Hα emission profile at 10% of the peak flux and then used a cutoff of υ10 ~ 200 km s–1, as proposed by Jayawardhana et al. (2003), to separate accreting and nonaccreting M dwarfs. Table 5 lists our measurements of υ10. Three young BD candidates, DENIS0322–3547, DENIS0500–3330, and DENIS1856–3655, are accretors. DENIS0338–2646 with υ10 = 194 ± 19 km s–1 close to the cutoff is a potential accretor. By combining the low-and medium-resolution spectra, we identified seven accretors and one potential accretor. The R3000 spectra with a resolution of ~3000 are probably not high enough to properly measure the accretion rate, especially in mid- and late-M dwarfs, because TiO bands at 6569 Å (Kirkpatrick et al. 1991) significantly contaminate the Hα emission. We therefore only used the R7000 spectra to measure the accretion rate in accreting BD candidates. Our measurements of the accretion rate are listed in Table 5.
Figure 6 shows the R7000 Hα velocity profiles of the six young BD candidates. The member of Columba, DENIS0500–3330, also shows an inverse-P Cygni Hα profile, as observed in young BDs (Muzerolle et al. 2003), indicating magnetospheric accretion (Edwards et al. 1994). The accretion rate in this young BD is 10–9.5M⊙ yr–1, which is comparable to the young BD ISO-Oph 102 (~1 Myr) with an accretion rate of 10–9.0 M⊙ yr–1 (Natta et al. 2004) and lies in the range of accretion rates of 10–10.5 –10–7.9 M⊙ yr–1 in the 1 Myr old BD DENIS-P J1538317–103850 (Nguyen-Thanh et al. 2020). Our estimated age of DENIS0500–3330 is 20 Myr, indicating that the accretion and the associated outflow in the young BD may be significantly longer-lived than in low-mass stars. The long-lived outflow process will sweep out a significant amount of gas from the protoplanetary disks and will thus favor the formation of rocky planets around VLM objects (e.g., Phan-Bao et al. 2008b).
Ηα and Li I 6708 Å EWs, velocity width υ10, and accretion rate Ṁ estimated from the R7000 spectra for six young BD candidates.
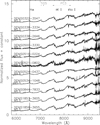 |
Fig. 2 R3000 spectra of 11 IR excess candidates. Our spectral types adopted from spectral indices VOa, TiO5, and PC3 (see Table 4) are also shown. |
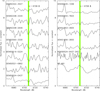 |
Fig. 3 R3000 spectra of 11 candidates. The region of the Li I line is indicated. The R600R INT spectrum of DENIS0524–0437 is shown. The low-resolution spectrum of WT 460 (M5.5) without a lithium detection (Phan-Bao et al. 2017) is also shown for comparison. |
4 Conclusion
We presented the detection of 21 young BD candidates (29–74 MJup) and two young VLM stars (83 MJup, 104 MJup) with protoplanetary disks. Ten of these disks are new: 3 in XFor, 1 in Col, 4 in Ori, 1 in Cen, and 1 in UCrA. DENIS0534–1048 might be the first BD candidate member of a foreground population in front of the OriD cloud associated with κ Ori. Further observations are required to clarify the membership of DENIS0534–1048 and confirm the existence of the OriD-foreground population. For 3 candidates without Gaia parallaxes, DENIS0516–0224 and DENIS0524–0437 in Ori, and DENIS1406–4151 in Cen, trigonometric parallaxes are also needed to confirm their membership. Our spectro-scopic observations revealed lithium in six young BD candidates, which supports their youth, as predicted by the theoretical models. Based on our low- and medium-resolution spectra, we identified seven accretors: DENIS0322–3547 (M5.5, XFor) DENIS0500–3330 (M6.0, Col), DENIS0516–0224 (M5.0, Ori), DENIS0524–0437 (M4.5, Ori), DENIS0534–1048 (M5.5, OriD-foreground), DENIS0844–7833 (M5.5, η Cha), and DENIS1856–3655 (M5.5, UCrA) and one potential accretor: DENIS0338–2646 (M5.5, XFor). The long-lived accretion and probably the associated long-lived outflow in the 20 Myr old BD candidate, DENIS0500–3330 provide additional evidence that favors the formation of rocky planets around VLM stars and BDs.
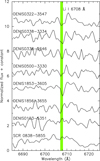 |
Fig. 4 R7000 spectra of six candidates (see Table 5). The region of the Li I line is indicated. The spectra of DENIS0103–5351 (M5.5) and SCR 0838–5855 (M6.0) without a lithium detection (Phan-Bao et al. 2017) are also plotted for comparison. |
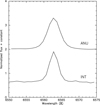 |
Fig. 5 Spectra of DENIS0524–0437 observed on October 11, 2023 with ANU and December 3, 2023 with INT. The change in Hα EW measured in the ANU and INT spectra implies an accretion process in DENIS0524–0437 (see Sect. 3.2 for further discussion). |
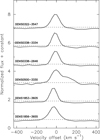 |
Fig. 6 R7000 Hα velocity profiles of six candidates (see Table 5). The dashed line indicates the full width at 10% of the peak. |
Acknowledgements
We would like to thank the referee for useful comments. This research is funded by Vietnam National Foundation for Science and Technology Development (NAFOSTED) under grant number 103.99-2020.63. ELM is supported by the European Research Council Advanced grant SUBSTELLAR, project number 101054354. This publication makes use of data products from the Wide-field Infrared Survey Explorer, which is a joint project of the University of California, Los Angeles, and the Jet Propulsion Laboratory/California Institute of Technology, funded by the National Aeronautics and Space Administration. This work has made use of data from the European Space Agency (ESA) mission Gaia (https://www.cosmos.esa.int/gaia), processed by the Gaia Data Processing and Analysis Consortium (DPAC, https://www.cosmos.esa.int/web/gaia/dpac/consortium). Funding for the DPAC has been provided by national institutions, in particular the institutions participating in the Gaia Multilateral Agreement. The DENIS project has been partly funded by the SCIENCE and the HCM plans of the European Commission under grants CT920791 and CT940627. It is supported by INSU, MEN and CNRS in France, by the State of Baden-Württemberg in Germany, by DGICYT in Spain, by CNR in Italy, by FFwFBWF in Austria, by FAPESP in Brazil, by OTKA grants F-4239 and F-013990 in Hungary, and by the ESO C&EE grant A-04-046. Jean Claude Renault from IAP was the Project manager. Observations were carried out thanks to the contribution of numerous students and young scientists from all involved institutes, under the supervision of P. Fouqué, survey astronomer resident in Chile. This publication makes use of data products from the Two Micron All Sky Survey, which is a joint project of the University of Massachusetts and the Infrared Processing and Analysis Center/California Institute of Technology, funded by the National Aeronautics and Space Administration and the National Science Foundation. This research has made use of the VizieR catalogue access tool, CDS, Strasbourg, France. The original description of the VizieR service was published in A&AS 143, 23. This research has made use of the SIMBAD database, operated at CDS, Strasbourg, France.
Appendix A SED of late-M dwarfs
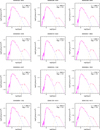 |
Fig. A.1 SEDs for all 23 candidates with detected IR excesses. The blue dash-dotted line shows the BT-Settl model atmosphere. The disk blackbody model is indicated by the orange dashed line. Our best fit to the photometric data is shown by the magenta solid line. Effective temperature T★ and surface gravity log ɡ estimated from the BT-Settl model are also shown. |
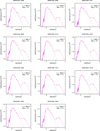 |
Fig. A.1 continued. |
References
- Allard, F., Homeier, D., Freytag, B., Schaffenberger, W., & Rajpurohit, A. S. 2013, Mem. Soc. Astron. Ital. Suppl., 24, 128 [Google Scholar]
- Ardila, D., Martín, E., & Basri, G. 2000, AJ, 120, 479 [NASA ADS] [CrossRef] [Google Scholar]
- Baraffe, I., Homeier, D., Allard, F., & Chabrier, G. 2015, A&A, 577, A42 [NASA ADS] [CrossRef] [EDP Sciences] [Google Scholar]
- Barrado y Navascués, D., & Martín, E. L. 2003, AJ, 126, 2997 [Google Scholar]
- Bessell, M. S. 1999, PASP, 111, 1426 [NASA ADS] [CrossRef] [Google Scholar]
- Boucher, A., Lafrenière, D., Gagné, J., et al. 2016, ApJ, 832, 50 [NASA ADS] [CrossRef] [Google Scholar]
- Cantat-Gaudin, T., Jordi, C., Vallenari, A., et al. 2018, A&A, 618, A93 [NASA ADS] [CrossRef] [EDP Sciences] [Google Scholar]
- Cayrel, R. 1988, in IAU Symposium, 132, The Impact of Very High S/N Spectroscopy on Stellar Physics, eds. G. Cayrel de Strobel, & M. Spite, 345 [NASA ADS] [CrossRef] [Google Scholar]
- Cifuentes, C., Caballero, J. A., Cortés-Contreras, M., et al. 2020, A&A, 642, A115 [NASA ADS] [CrossRef] [EDP Sciences] [Google Scholar]
- Cohen, M., Wheaton, W. A., & Megeath, S. T. 2003, AJ, 126, 1090 [Google Scholar]
- Cooper, W. J., Smart, R. L., Jones, H. R. A., & Sarro, L. M. 2024, MNRAS, 527, 1521 [Google Scholar]
- Cruz, K. L., & Reid, I. N. 2002, AJ, 123, 2828 [NASA ADS] [CrossRef] [Google Scholar]
- Cutri, R. M., Wright, E. L., Conrow, T., et al. 2014, VizieR Online Data Catalog: AllWISE Data Release (Cutri+ 2013), VizieR On-line Data Catalog: II/328. Originally published in: IPAC/Caltech (2013) [Google Scholar]
- Damiani, F., Prisinzano, L., Pillitteri, I., Micela, G., & Sciortino, S. 2019, A&A, 623, A112 [NASA ADS] [CrossRef] [EDP Sciences] [Google Scholar]
- Dawson, P., Scholz, A., Ray, T. P., et al. 2013, MNRAS, 429, 903 [NASA ADS] [CrossRef] [Google Scholar]
- Dopita, M., Hart, J., McGregor, P., et al. 2007, Ap&SS, 310, 255 [Google Scholar]
- Edwards, S., Hartigan, P., Ghandour, L., & Andrulis, C. 1994, AJ, 108, 1056 [Google Scholar]
- Esplin, T. L., & Luhman, K. L. 2022, AJ, 163, 64 [NASA ADS] [CrossRef] [Google Scholar]
- Esplin, T. L., Luhman, K. L., Miller, E. B., & Mamajek, E. E. 2018, AJ, 156, 75 [NASA ADS] [CrossRef] [Google Scholar]
- Fouqué, P., Chevallier, L., Cohen, M., et al. 2000, A&AS, 141, 313 [NASA ADS] [CrossRef] [EDP Sciences] [Google Scholar]
- Gagné, J., & Faherty, J. K. 2018, ApJ, 862, 138 [Google Scholar]
- Gagné, J., Faherty, J. K., Cruz, K. L., et al. 2015, ApJS, 219, 33 [CrossRef] [Google Scholar]
- Gagné, J., Mamajek, E. E., Malo, L., et al. 2018, ApJ, 856, 23 [Google Scholar]
- Gaia Collaboration (Prusti, T., et al.) 2016, A&A, 595, A1 [NASA ADS] [CrossRef] [EDP Sciences] [Google Scholar]
- Gaia Collaboration (Vallenari, A., et al.) 2023, A&A, 674, A1 [NASA ADS] [CrossRef] [EDP Sciences] [Google Scholar]
- Galli, P. A. B., Bouy, H., Olivares, J., et al. 2020, A&A, 634, A98 [NASA ADS] [CrossRef] [EDP Sciences] [Google Scholar]
- Galli, P. A. B., Bouy, H., Olivares, J., et al. 2021, A&A, 654, A122 [NASA ADS] [CrossRef] [EDP Sciences] [Google Scholar]
- Goldman, B., Röser, S., Schilbach, E., Mo?r, A. C., & Henning, T. 2018, ApJ, 868, 32 [Google Scholar]
- Hughes, A. M., Duchêne, G., & Matthews, B. C. 2018, ARA&A, 56, 541 [Google Scholar]
- Jayawardhana, R., Mohanty, S., & Basri, G. 2003, ApJ, 592, 282 [NASA ADS] [CrossRef] [Google Scholar]
- Kirkpatrick, J. D., Henry, T. J., & McCarthy, Donald W., J. 1991, ApJS, 77, 417 [NASA ADS] [CrossRef] [Google Scholar]
- Kounkel, M., Covey, K., Suárez, G., et al. 2018, AJ, 156, 84 [NASA ADS] [CrossRef] [Google Scholar]
- Lodieu, N. 2013, MNRAS, 431, 3222 [NASA ADS] [CrossRef] [Google Scholar]
- Luhman, K. L. 2022, AJ, 163, 25 [NASA ADS] [CrossRef] [Google Scholar]
- Luhman, K. L., & Steeghs, D. 2004, ApJ, 609, 917 [NASA ADS] [CrossRef] [Google Scholar]
- Lyo, A. R., Lawson, W. A., & Bessell, M. S. 2004, MNRAS, 355, 363 [NASA ADS] [CrossRef] [Google Scholar]
- Martín, E. L. 1998, AJ, 115, 351 [CrossRef] [Google Scholar]
- Martín, E. L., Rebolo, R., & Zapatero-Osorio, M. R. 1996, ApJ, 469, 706 [NASA ADS] [CrossRef] [Google Scholar]
- Martín, E. L., Phan-Bao, N., Bessell, M., et al. 2010, A&A, 517, A53 [Google Scholar]
- Martín, E. L., Žerjal, M., Bouy, H., et al. 2025, A&A, 697, A7 [NASA ADS] [CrossRef] [EDP Sciences] [Google Scholar]
- Megeath, S. T., Hartmann, L., Luhman, K. L., & Fazio, G. G. 2005, ApJ, 634, L113 [NASA ADS] [CrossRef] [Google Scholar]
- Morales, F. Y., Padgett, D. L., Bryden, G., Werner, M. W., & Furlan, E. 2012, ApJ, 757, 7 [Google Scholar]
- Morales-Gutiérrez, S., Nagel, E., & Barragan, O. 2021, MNRAS, 506, 5361 [CrossRef] [Google Scholar]
- Muzerolle, J., Hillenbrand, L., Calvet, N., Briceño, C., & Hartmann, L. 2003, ApJ, 592, 266 [NASA ADS] [CrossRef] [Google Scholar]
- Natta, A., Testi, L., Muzerolle, J., et al. 2004, A&A, 424, 603 [NASA ADS] [CrossRef] [EDP Sciences] [Google Scholar]
- Nguyen-Thanh, D., Phan-Bao, N., Murphy, S. J., & Bessell, M. S. 2020, A&A, 634, A128 [EDP Sciences] [Google Scholar]
- Peterson, D. E., Caratti o Garatti, A., Bourke, T. L., et al. 2011, ApJS, 194, 43 [NASA ADS] [CrossRef] [Google Scholar]
- Phan-Bao, N., & Bessell, M. S. 2006, A&A, 446, 515 [NASA ADS] [CrossRef] [EDP Sciences] [Google Scholar]
- Phan-Bao, N., Guibert, J., Crifo, F., et al. 2001, A&A, 380, 590 [NASA ADS] [CrossRef] [EDP Sciences] [Google Scholar]
- Phan-Bao, N., Crifo, F., Delfosse, X., et al. 2003, A&A, 401, 959 [NASA ADS] [CrossRef] [EDP Sciences] [Google Scholar]
- Phan-Bao, N., Bessell, M. S., Martín, E. L., et al. 2008a, MNRAS, 383, 831 [NASA ADS] [CrossRef] [Google Scholar]
- Phan-Bao, N., Riaz, B., Lee, C.-F., et al. 2008b, ApJ, 689, L141 [Google Scholar]
- Phan-Bao, N., Bessell, M. S., Nguyen-Thanh, D., et al. 2017, A&A, 600, A19 [NASA ADS] [CrossRef] [EDP Sciences] [Google Scholar]
- Pillitteri, I., Wolk, S. J., & Megeath, S. T. 2016, ApJ, 820, L28 [Google Scholar]
- Reid, I. N., Cruz, K. L., Allen, P., et al. 2003, AJ, 126, 3007 [NASA ADS] [CrossRef] [Google Scholar]
- Roman, N. G. 1987, PASP, 99, 695 [Google Scholar]
- Sarro, L. M., Berihuete, A., Smart, R. L., et al. 2023, A&A, 669, A139 [NASA ADS] [CrossRef] [EDP Sciences] [Google Scholar]
- Schlieder, J. E., Lépine, S., Rice, E., et al. 2012, AJ, 143, 114 [NASA ADS] [CrossRef] [Google Scholar]
- Schneider, A. C., Shkolnik, E. L., Allers, K. N., et al. 2019, AJ, 157, 234 [Google Scholar]
- Sgro, L. A., & Song, I. 2021, MNRAS, 508, 3084 [Google Scholar]
- Shortridge, K., Meyerdierks, H., Currie, M., et al. 2004, Starlink User Note, 86 [Google Scholar]
- Skrutskie, M. F., Cutri, R. M., Stiening, R., et al. 2006, AJ, 131, 1163 [NASA ADS] [CrossRef] [Google Scholar]
- Song, I., Zuckerman, B., & Bessell, M. S. 2004, ApJ, 600, 1016 [NASA ADS] [CrossRef] [Google Scholar]
- Teixeira, P. S., Scholz, A., & Alves, J. 2020, A&A, 642, A86 [NASA ADS] [CrossRef] [EDP Sciences] [Google Scholar]
- Theissen, C. A., & West, A. A. 2017, AJ, 153, 165 [Google Scholar]
- White, R. J., & Basri, G. 2003, ApJ, 582, 1109 [Google Scholar]
- Wright, E. L., Eisenhardt, P. R. M., Mainzer, A. K., et al. 2010, AJ, 140, 1868 [Google Scholar]
- Zapatero Osorio, M. R., Béjar, V. J. S., Martín, E. L., et al. 2000, Science, 290, 103 [NASA ADS] [CrossRef] [Google Scholar]
All Tables
Star and disk properties and membership in young associations of the 23 BD candidates and VLM stars.
Hα, Li I 6708 Å, and Na I (8170–8200 Å) EWs, spectral indices and spectral types estimated from the R3000 spectra for 11 young BD candidates and VLM stars.
Ηα and Li I 6708 Å EWs, velocity width υ10, and accretion rate Ṁ estimated from the R7000 spectra for six young BD candidates.
All Figures
|
Fig. 1 2MASS J-band absolute magnitude vs. I – J color diagram for 23 candidates with available Gaia parallaxes. The DENIS I-band and 2MASS J-band photometric data are listed in Table 1. Isochrones and mass tracks from the BT-Settl CIFIST 2011–2015 models (Baraffe et al. 2015) are plotted. The hatched blue area indicates the region in which lithium is not completely depleted and can be detected in the stellar atmosphere. |
| In the text | |
|
Fig. 2 R3000 spectra of 11 IR excess candidates. Our spectral types adopted from spectral indices VOa, TiO5, and PC3 (see Table 4) are also shown. |
| In the text | |
|
Fig. 3 R3000 spectra of 11 candidates. The region of the Li I line is indicated. The R600R INT spectrum of DENIS0524–0437 is shown. The low-resolution spectrum of WT 460 (M5.5) without a lithium detection (Phan-Bao et al. 2017) is also shown for comparison. |
| In the text | |
|
Fig. 4 R7000 spectra of six candidates (see Table 5). The region of the Li I line is indicated. The spectra of DENIS0103–5351 (M5.5) and SCR 0838–5855 (M6.0) without a lithium detection (Phan-Bao et al. 2017) are also plotted for comparison. |
| In the text | |
|
Fig. 5 Spectra of DENIS0524–0437 observed on October 11, 2023 with ANU and December 3, 2023 with INT. The change in Hα EW measured in the ANU and INT spectra implies an accretion process in DENIS0524–0437 (see Sect. 3.2 for further discussion). |
| In the text | |
|
Fig. 6 R7000 Hα velocity profiles of six candidates (see Table 5). The dashed line indicates the full width at 10% of the peak. |
| In the text | |
|
Fig. A.1 SEDs for all 23 candidates with detected IR excesses. The blue dash-dotted line shows the BT-Settl model atmosphere. The disk blackbody model is indicated by the orange dashed line. Our best fit to the photometric data is shown by the magenta solid line. Effective temperature T★ and surface gravity log ɡ estimated from the BT-Settl model are also shown. |
| In the text | |
|
Fig. A.1 continued. |
| In the text | |
Current usage metrics show cumulative count of Article Views (full-text article views including HTML views, PDF and ePub downloads, according to the available data) and Abstracts Views on Vision4Press platform.
Data correspond to usage on the plateform after 2015. The current usage metrics is available 48-96 hours after online publication and is updated daily on week days.
Initial download of the metrics may take a while.