Fig. 2.
Download original image
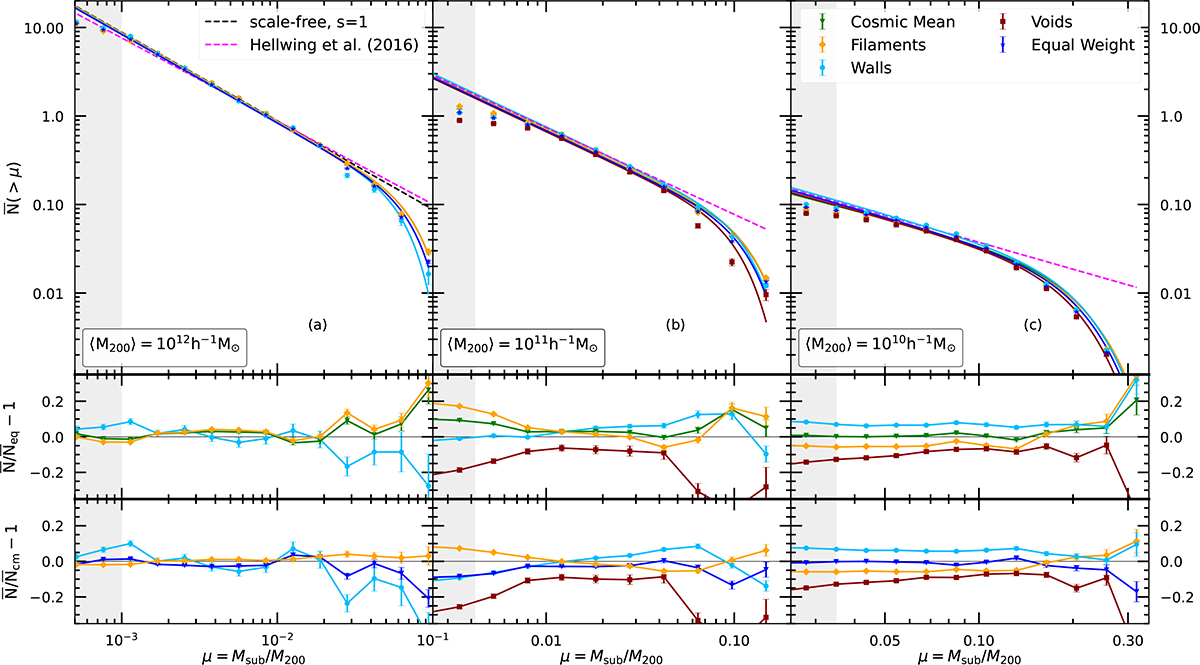
Upper panels: mean cumulative subhalo mass functions for host haloes in three different mass bins, ⟨M200⟩, shown as data points, sampled from different environments: cosmic mean (green triangles), filaments (yellow diamonds), walls (light blue circles), voids (dark red squares), and our synthetic equally weighted sample (dark blue stars). The error bars represent bootstrapped 1σ uncertainties. The solid lines with matching colours indicate the best fits to the exponential power-law model from Eq. (4). The grey shaded regions on the left of each panel indicate the subhalo resolution limit, μmin. The two dashed lines illustrate the single power-law models for the scale-free case (black) and the best fit from the COCO simulations (magenta) of Hellwing et al. (2016). Middle panels: fractional deviation of each subhalo mass function with respect to the equally weighted sample, D. Lower panels: Fractional deviation with respect to the cosmic mean, 𝒟. The error bars in the ratio panels show uncertainties calculated through standard error propagation. We note the different ranges of the x-axes among the panels.
Current usage metrics show cumulative count of Article Views (full-text article views including HTML views, PDF and ePub downloads, according to the available data) and Abstracts Views on Vision4Press platform.
Data correspond to usage on the plateform after 2015. The current usage metrics is available 48-96 hours after online publication and is updated daily on week days.
Initial download of the metrics may take a while.