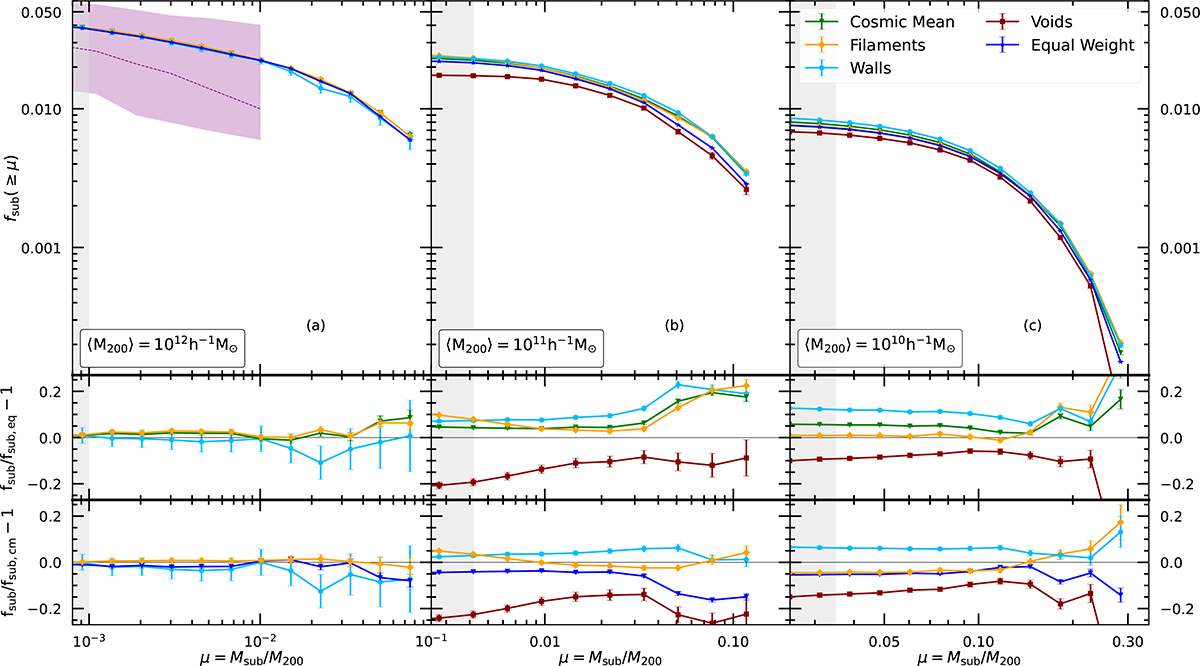
Fig. 3.
Download original image
Upper panels: fraction of the host halo mass in substructures. We show the same environmental samples as in Fig. 2 for the two mass bins where the μ ranges are above the resolution limits. As before, the error bars correspond to the bootstrapped 1σ errors. The grey shaded regions at the left of each panel show the subhalo resolution limit of the simulation. Middle panels: ratios of the substructure mass fraction in each environment with respect to the equally weighted sample, D. Lower panels: Ratios of the substructure mass fraction in each environment relative to the cosmic mean, 𝒟. The error bars in the ratio panel are estimated using standard error propagation. For comparison, we show the median and 60% scatter (dashed line and shaded region) from the MILLENNIUM II simulation (Gao et al. 2011).
Current usage metrics show cumulative count of Article Views (full-text article views including HTML views, PDF and ePub downloads, according to the available data) and Abstracts Views on Vision4Press platform.
Data correspond to usage on the plateform after 2015. The current usage metrics is available 48-96 hours after online publication and is updated daily on week days.
Initial download of the metrics may take a while.