Fig. 5.
Download original image
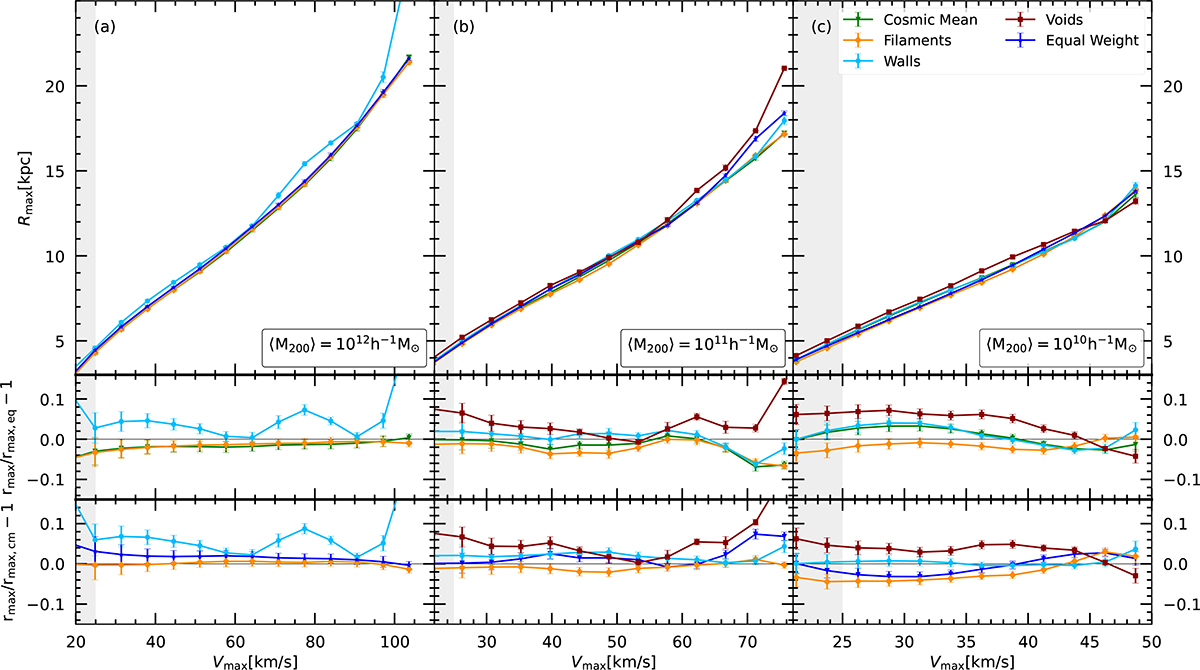
The mean Vmax–Rmax relation of the subhaloes within R200 for different host masses across different cosmic web environments. The error bars show the bootstrap errors on the mean. The grey shaded regions at the left of each panel show the subhalo resolution limit of the simulation. Upper panels: Solid lines with error bars represent subhaloes in voids (squares), walls (circles), filaments (diamonds), the cosmic mean sample (triangles), and the equally weighted sample (stars). Middle panels: Fractional deviation of the Rmax values of each environment from that of the equally weighted sample, D. Lower panels: Relative divergence of Rmax values compared to the full-volume sample, 𝒟. In the ratio panels, the error bars represent the uncertainty obtained via standard error propagation.
Current usage metrics show cumulative count of Article Views (full-text article views including HTML views, PDF and ePub downloads, according to the available data) and Abstracts Views on Vision4Press platform.
Data correspond to usage on the plateform after 2015. The current usage metrics is available 48-96 hours after online publication and is updated daily on week days.
Initial download of the metrics may take a while.