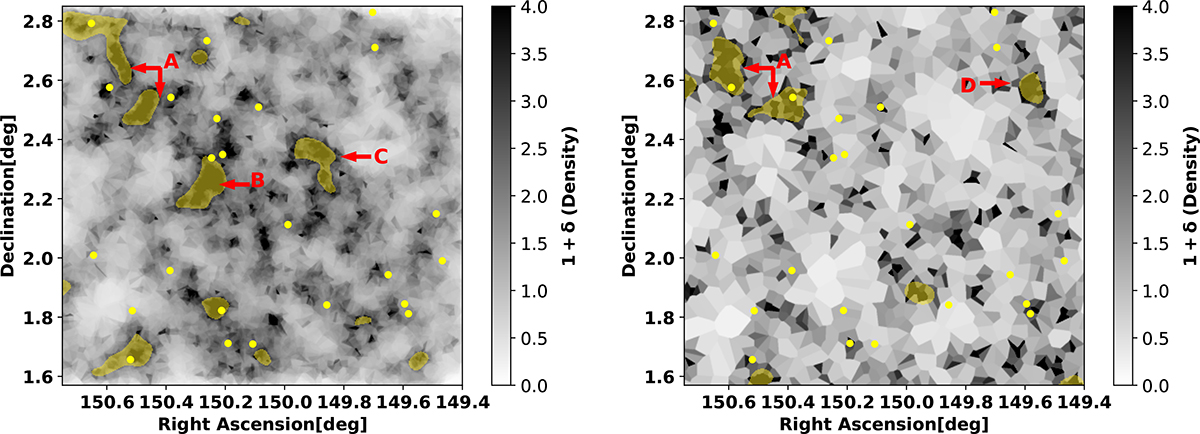
Fig. 4.
Download original image
Shaded yellow regions represent structures identified by running Source Extractor in the COSMOS2020 (left) and in the LAE (right) maps. The yellow dots represent MQGs. The colour bar scales the log(1 + δ) density for both maps as in Figure 2. Letters A, B, C, and D indicate some major overdensity groups that are discovered in either one or both maps.
Current usage metrics show cumulative count of Article Views (full-text article views including HTML views, PDF and ePub downloads, according to the available data) and Abstracts Views on Vision4Press platform.
Data correspond to usage on the plateform after 2015. The current usage metrics is available 48-96 hours after online publication and is updated daily on week days.
Initial download of the metrics may take a while.