Open Access
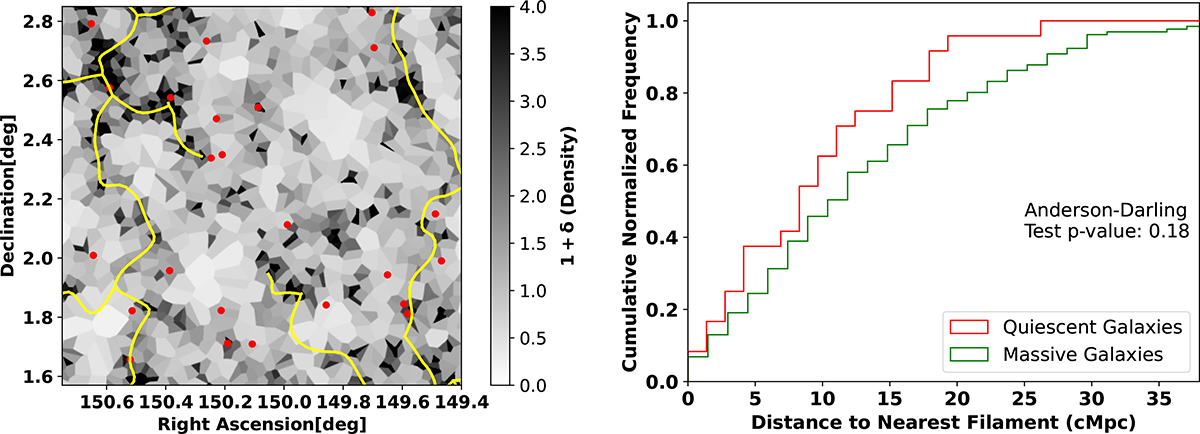
Fig. 9.
Download original image
Left: filaments (yellow lines) discovered using DisPerSE by Ramakrishnan et al. (2023), overplotted on the LAE density map. The red points represent the MQGs. Right: cumulative distribution of the distances to the nearest filaments for MQGs and MSFGs.
Current usage metrics show cumulative count of Article Views (full-text article views including HTML views, PDF and ePub downloads, according to the available data) and Abstracts Views on Vision4Press platform.
Data correspond to usage on the plateform after 2015. The current usage metrics is available 48-96 hours after online publication and is updated daily on week days.
Initial download of the metrics may take a while.