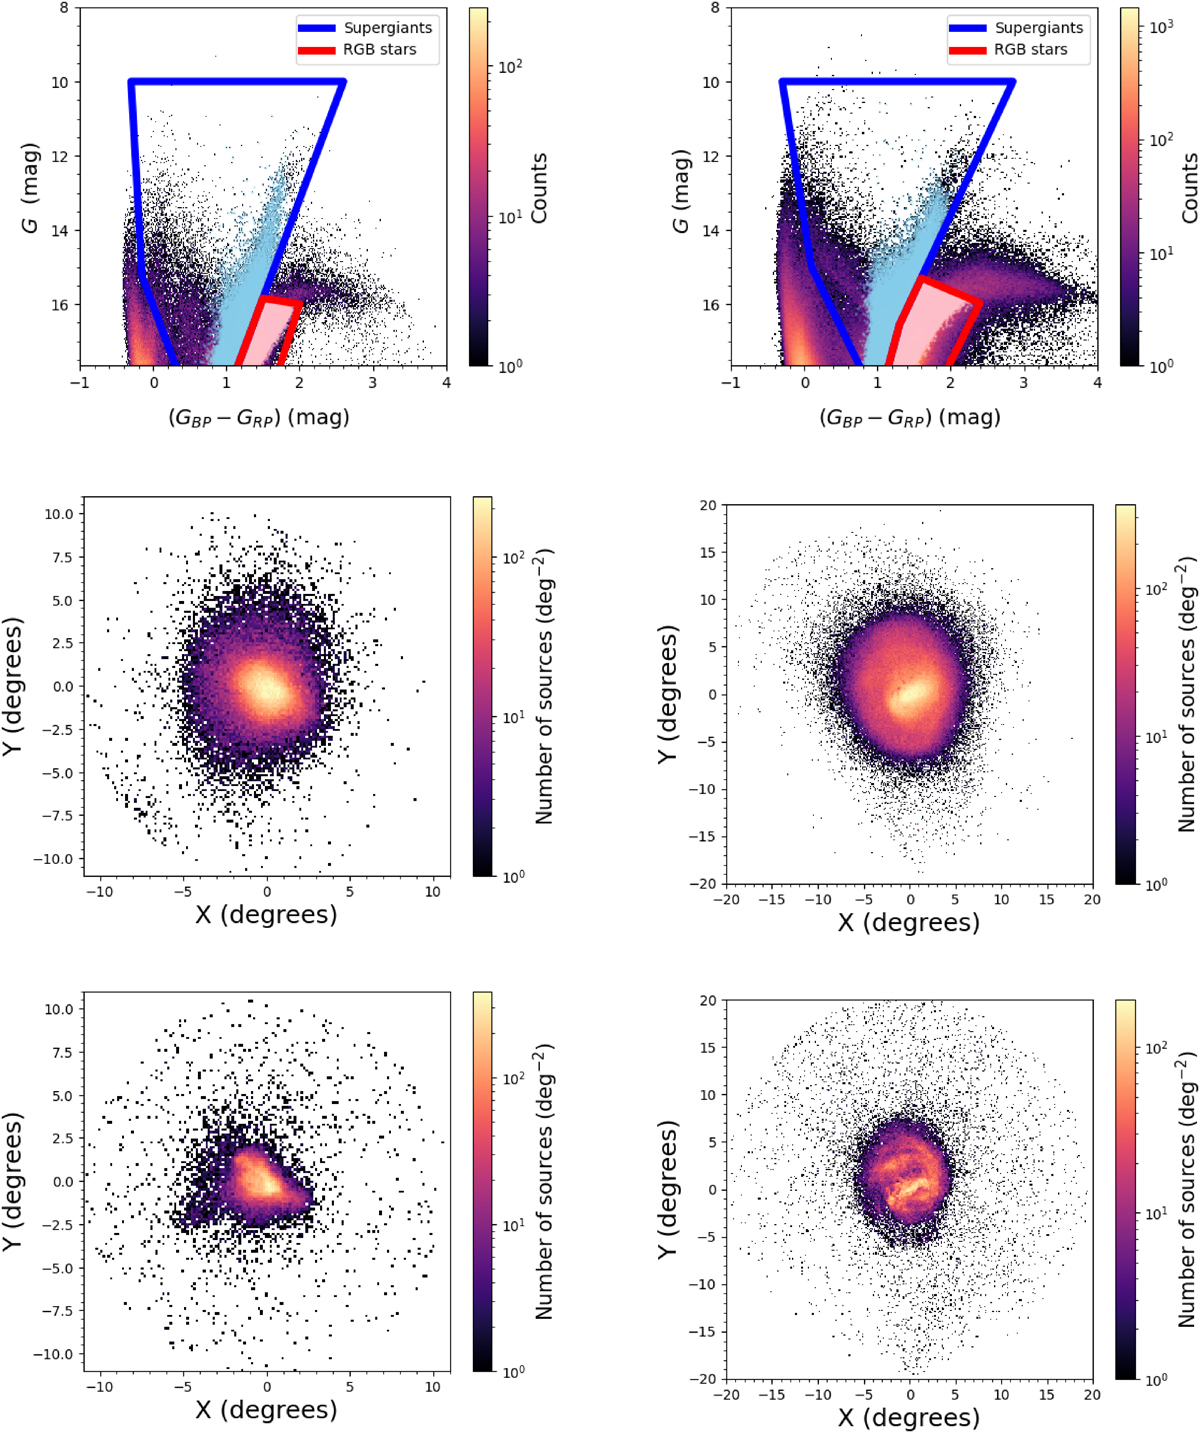
Fig. 1.
Download original image
Gaia DR3 CMD of the SMC (top-left) and the LMC (top-right) sources. In the plots, the regions used to select the supergiants (blue) and the RGB stars (red) are marked. The respective final selections (see text for details) of the RGB stars (pink) and supergiants (light blue) of the Clouds are also over-plotted. The middle-left and bottom-left show the number density distribution of the selected RGB and supergiant sources within ∼11 deg of the SMC from its centre (RA = 12.80 deg and Dec = −73.15 deg; Cioni et al. 2000). The middle-right and bottom-right panels show the distribution of the RGB and supergiant sources within ∼20 deg of the LMC from its centre (RA = 81.24 deg and Dec = −69.73 deg; van der Marel & Cioni 2001). The distributions are shown in zenithal equidistant projection coordinates X and Y, as defined in van der Marel & Cioni (2001). For the LMC we show a de-projected spatial distribution (refer to Sect. 2.2). The colour bar from black to yellow represents the increasing stellar densities in all the plots.
Current usage metrics show cumulative count of Article Views (full-text article views including HTML views, PDF and ePub downloads, according to the available data) and Abstracts Views on Vision4Press platform.
Data correspond to usage on the plateform after 2015. The current usage metrics is available 48-96 hours after online publication and is updated daily on week days.
Initial download of the metrics may take a while.