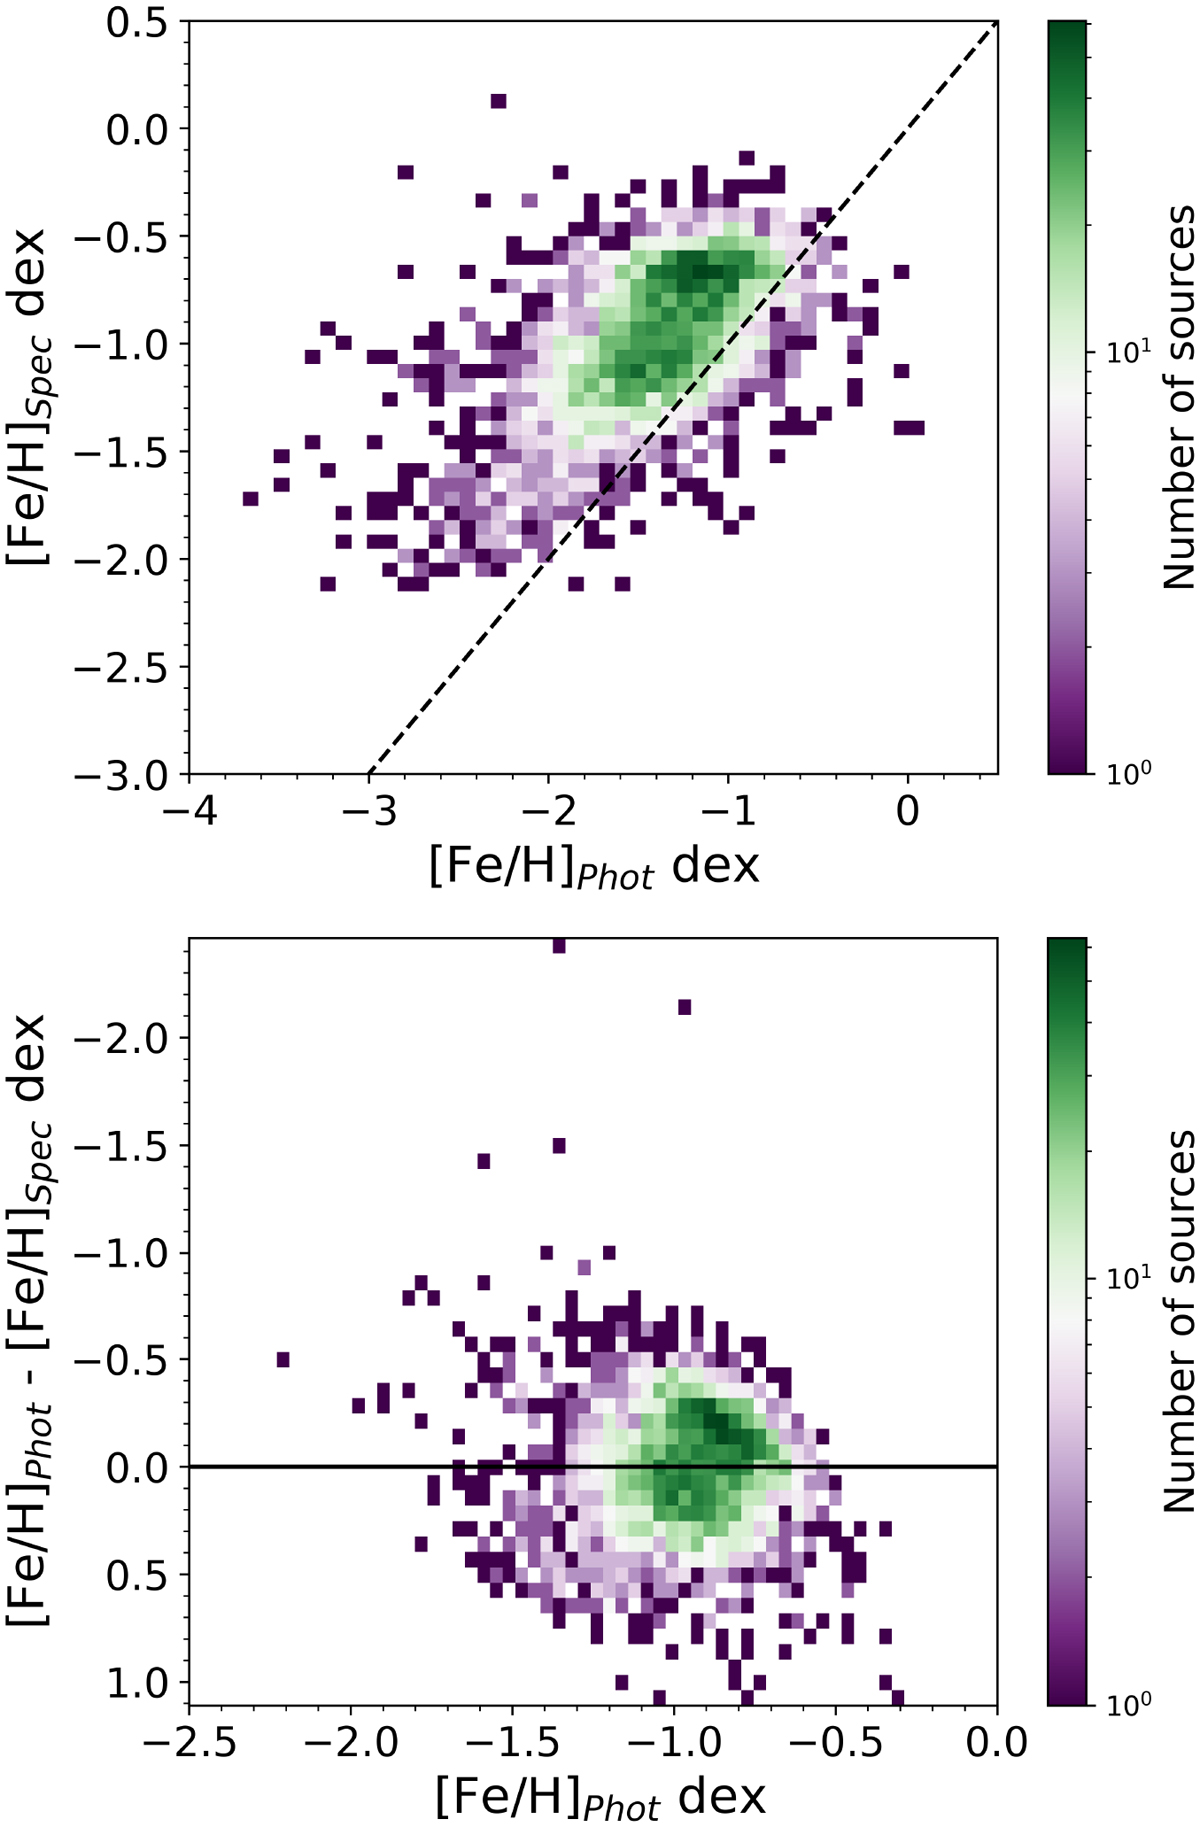
Fig. C.2.
Download original image
Photometric [Fe/H] versus spectroscopic [Fe/H] of the RGB sources are shown on the top panel. The dotted line marks the one-to-one relation. In the bottom panel, photometric [Fe/H] (recalibrated with the slope and constant) is plotted against the difference between them. The colour bar from violet to green shows the increase in stellar density.
Current usage metrics show cumulative count of Article Views (full-text article views including HTML views, PDF and ePub downloads, according to the available data) and Abstracts Views on Vision4Press platform.
Data correspond to usage on the plateform after 2015. The current usage metrics is available 48-96 hours after online publication and is updated daily on week days.
Initial download of the metrics may take a while.