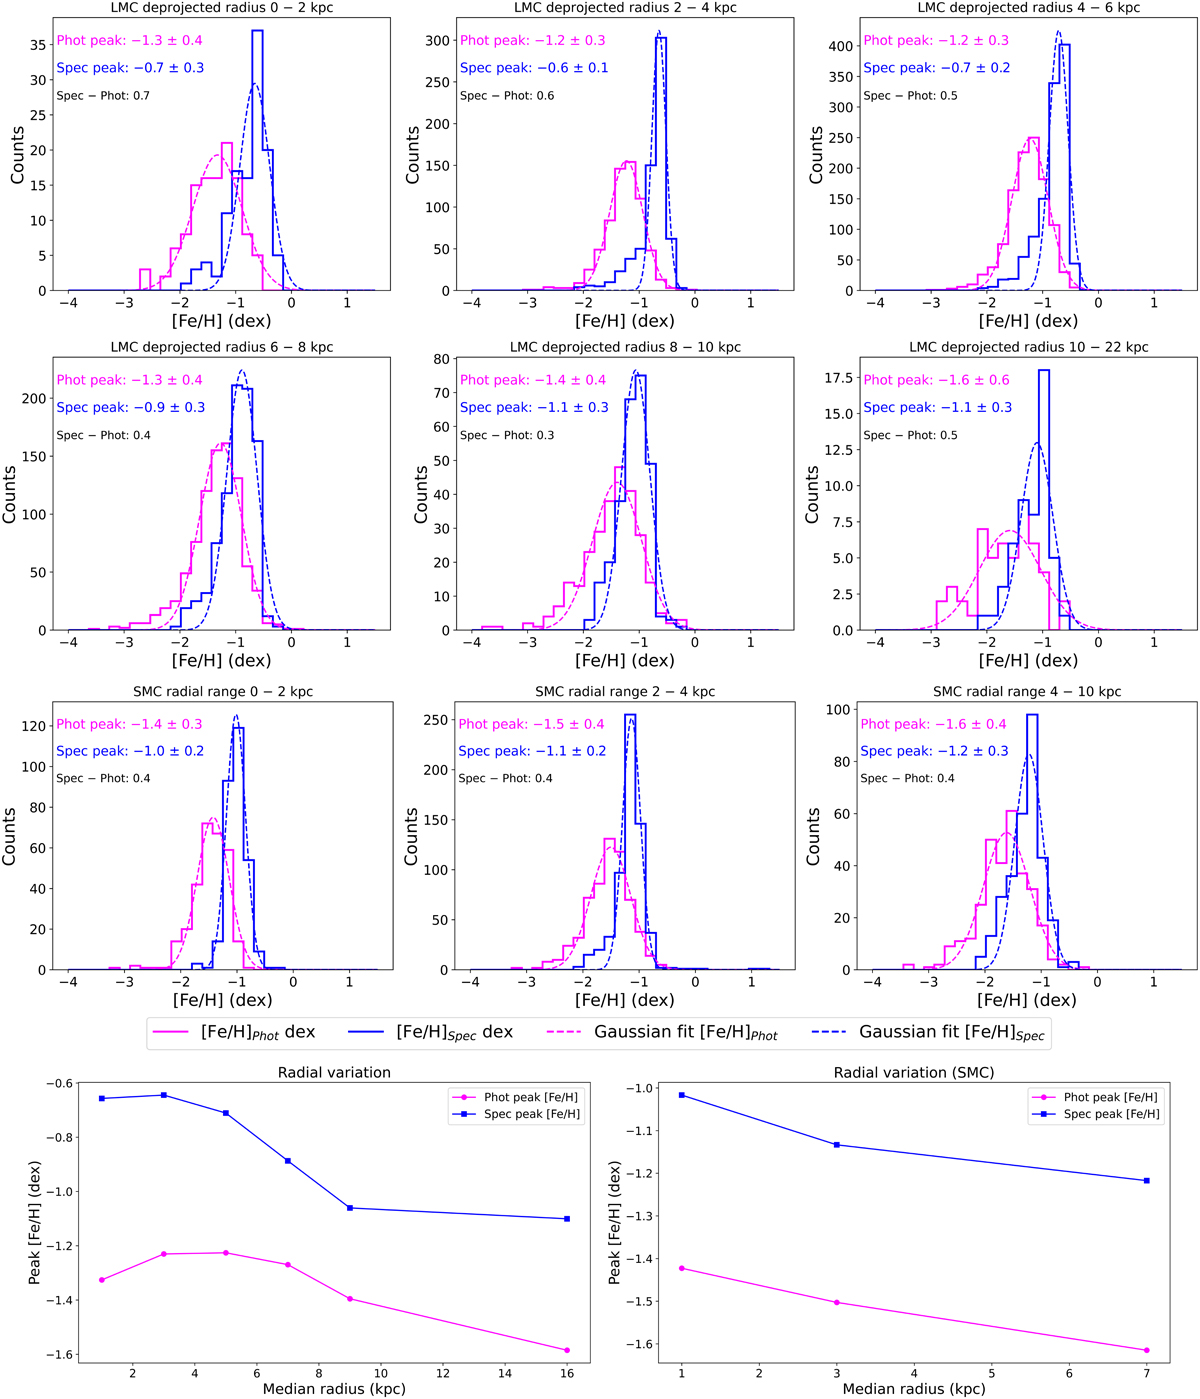
Fig. D.1.
Download original image
Radial variation of Photometric versus Spectroscopic metallicities in RGB Stars of the Clouds. The top and middle rows display the peak differences between the photometric (Phot; blue) and spectroscopic (Spec; pink) RGB samples, calculated for various radial ranges from the centre of the LMC. The third row presents similar data for the RGB stars in the SMC. Both peaks are fitted, and the peak values are shown in the last row: on the left for the LMC and on the right for the SMC, which illustrates the radial variation of the shifts from the respective centres.
Current usage metrics show cumulative count of Article Views (full-text article views including HTML views, PDF and ePub downloads, according to the available data) and Abstracts Views on Vision4Press platform.
Data correspond to usage on the plateform after 2015. The current usage metrics is available 48-96 hours after online publication and is updated daily on week days.
Initial download of the metrics may take a while.