Open Access
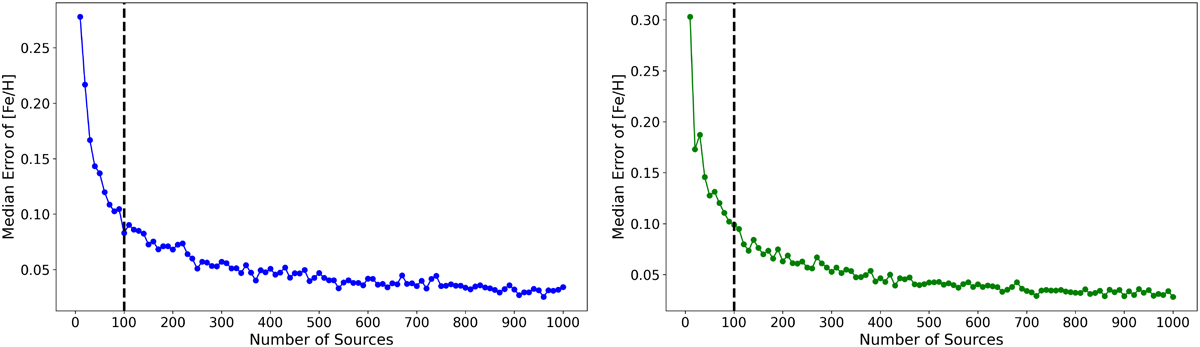
Fig. D.3.
Download original image
Median error of [Fe/H] plotted against the number of sources in each bin for RGB (left) and supergiant (right) stars in the Clouds. Dotted vertical lines at 100 sources indicate the limit adopted in our study.
Current usage metrics show cumulative count of Article Views (full-text article views including HTML views, PDF and ePub downloads, according to the available data) and Abstracts Views on Vision4Press platform.
Data correspond to usage on the plateform after 2015. The current usage metrics is available 48-96 hours after online publication and is updated daily on week days.
Initial download of the metrics may take a while.