Fig. D.5.
Download original image
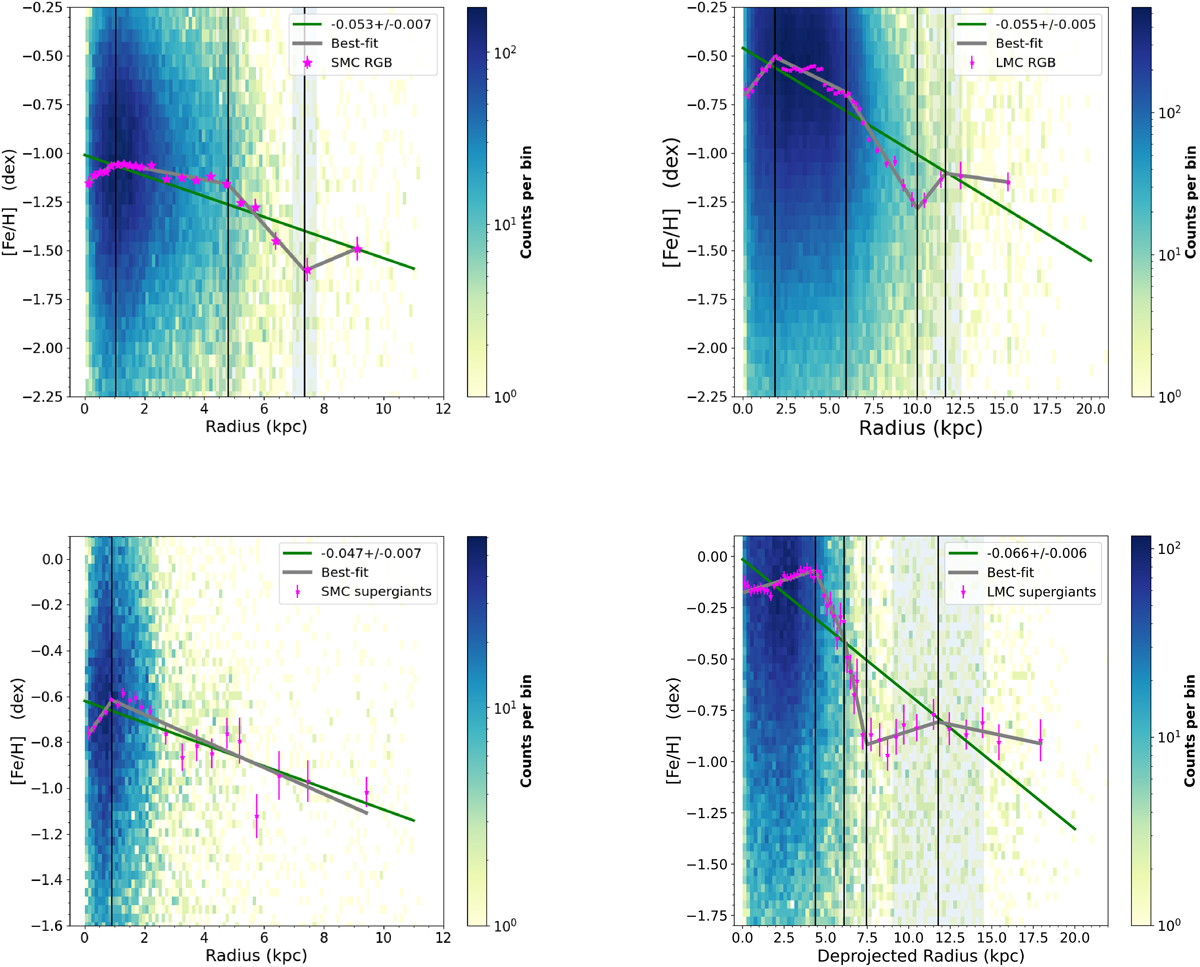
Radial metallicity gradient (in degrees) for the RGB (top) and supergiant (bottom) stars for SMC (left) and LMC (right). In all panels, the increasing stellar density is colour-coded from purple to yellow. The median metallicities of the annular regions are marked with pink stars along with their standard errors. Linear best-fits and segmented best-fits are shown in green and grey, respectively. The black vertical lines show the division of different segments at the location of the breaks in the gradients. Underlying Hess diagrams show the source-density distributions.
Current usage metrics show cumulative count of Article Views (full-text article views including HTML views, PDF and ePub downloads, according to the available data) and Abstracts Views on Vision4Press platform.
Data correspond to usage on the plateform after 2015. The current usage metrics is available 48-96 hours after online publication and is updated daily on week days.
Initial download of the metrics may take a while.