Fig. 6.
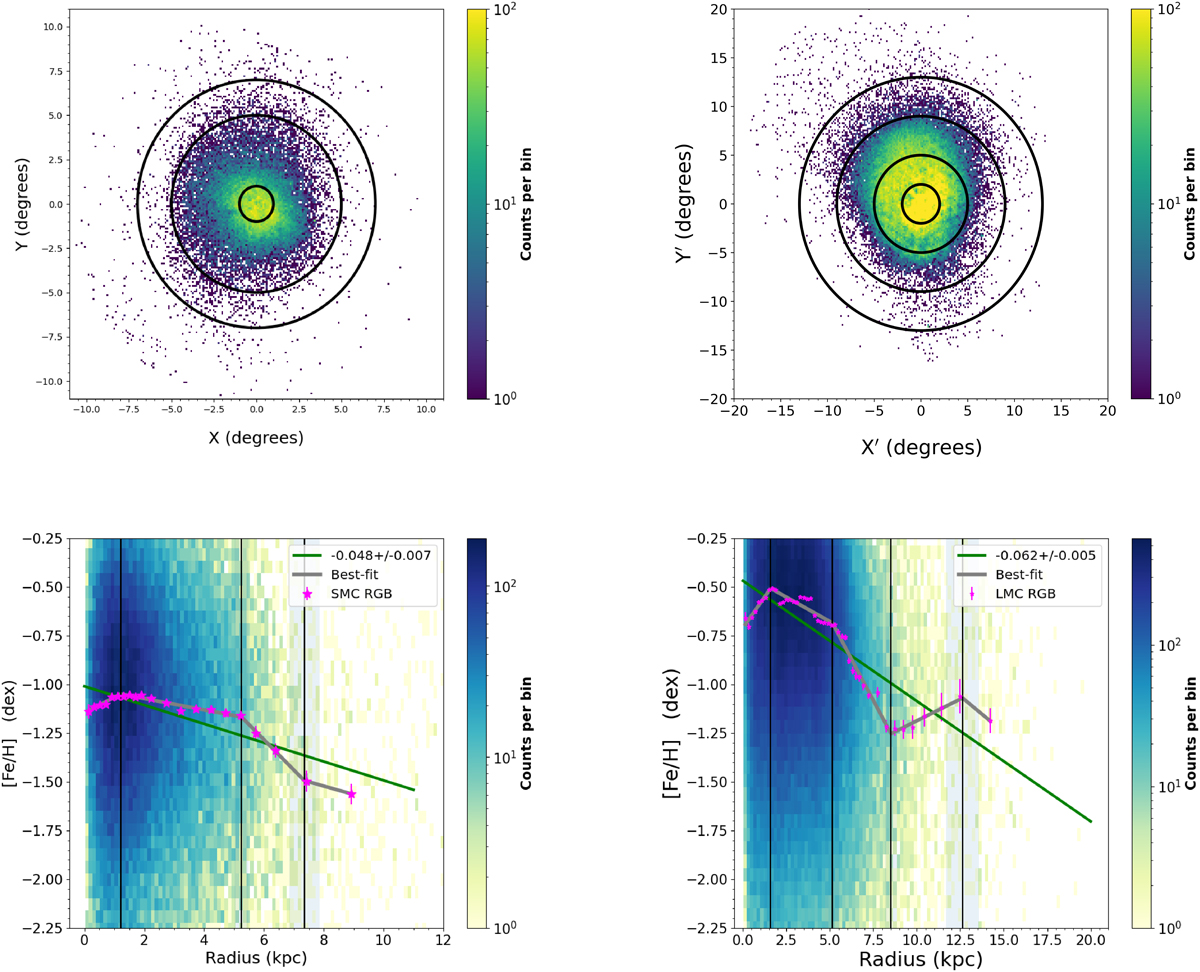
Download original image
Distribution of RGB stars within the SMC (top-left) and the LMC (top-right) with superimposed annular rings of breakpoints marked in the corresponding lower panels. The plots show the metallicity gradients for the SMC (bottom-left) and LMC RGB stars (bottom-right). The median metallicities of the annular bins are marked with pink stars along with their standard errors. Linear best-fits are marked with green and the piecewise-regression fits are marked with grey. The black vertical lines show the division of different segments or the location of the breaks in the gradient. In both panels, a Hess diagram shows the density distribution of the sources colour-coded such that blue shows the regions with the highest stellar density.
Current usage metrics show cumulative count of Article Views (full-text article views including HTML views, PDF and ePub downloads, according to the available data) and Abstracts Views on Vision4Press platform.
Data correspond to usage on the plateform after 2015. The current usage metrics is available 48-96 hours after online publication and is updated daily on week days.
Initial download of the metrics may take a while.