Open Access
Fig. A.1.
Download original image
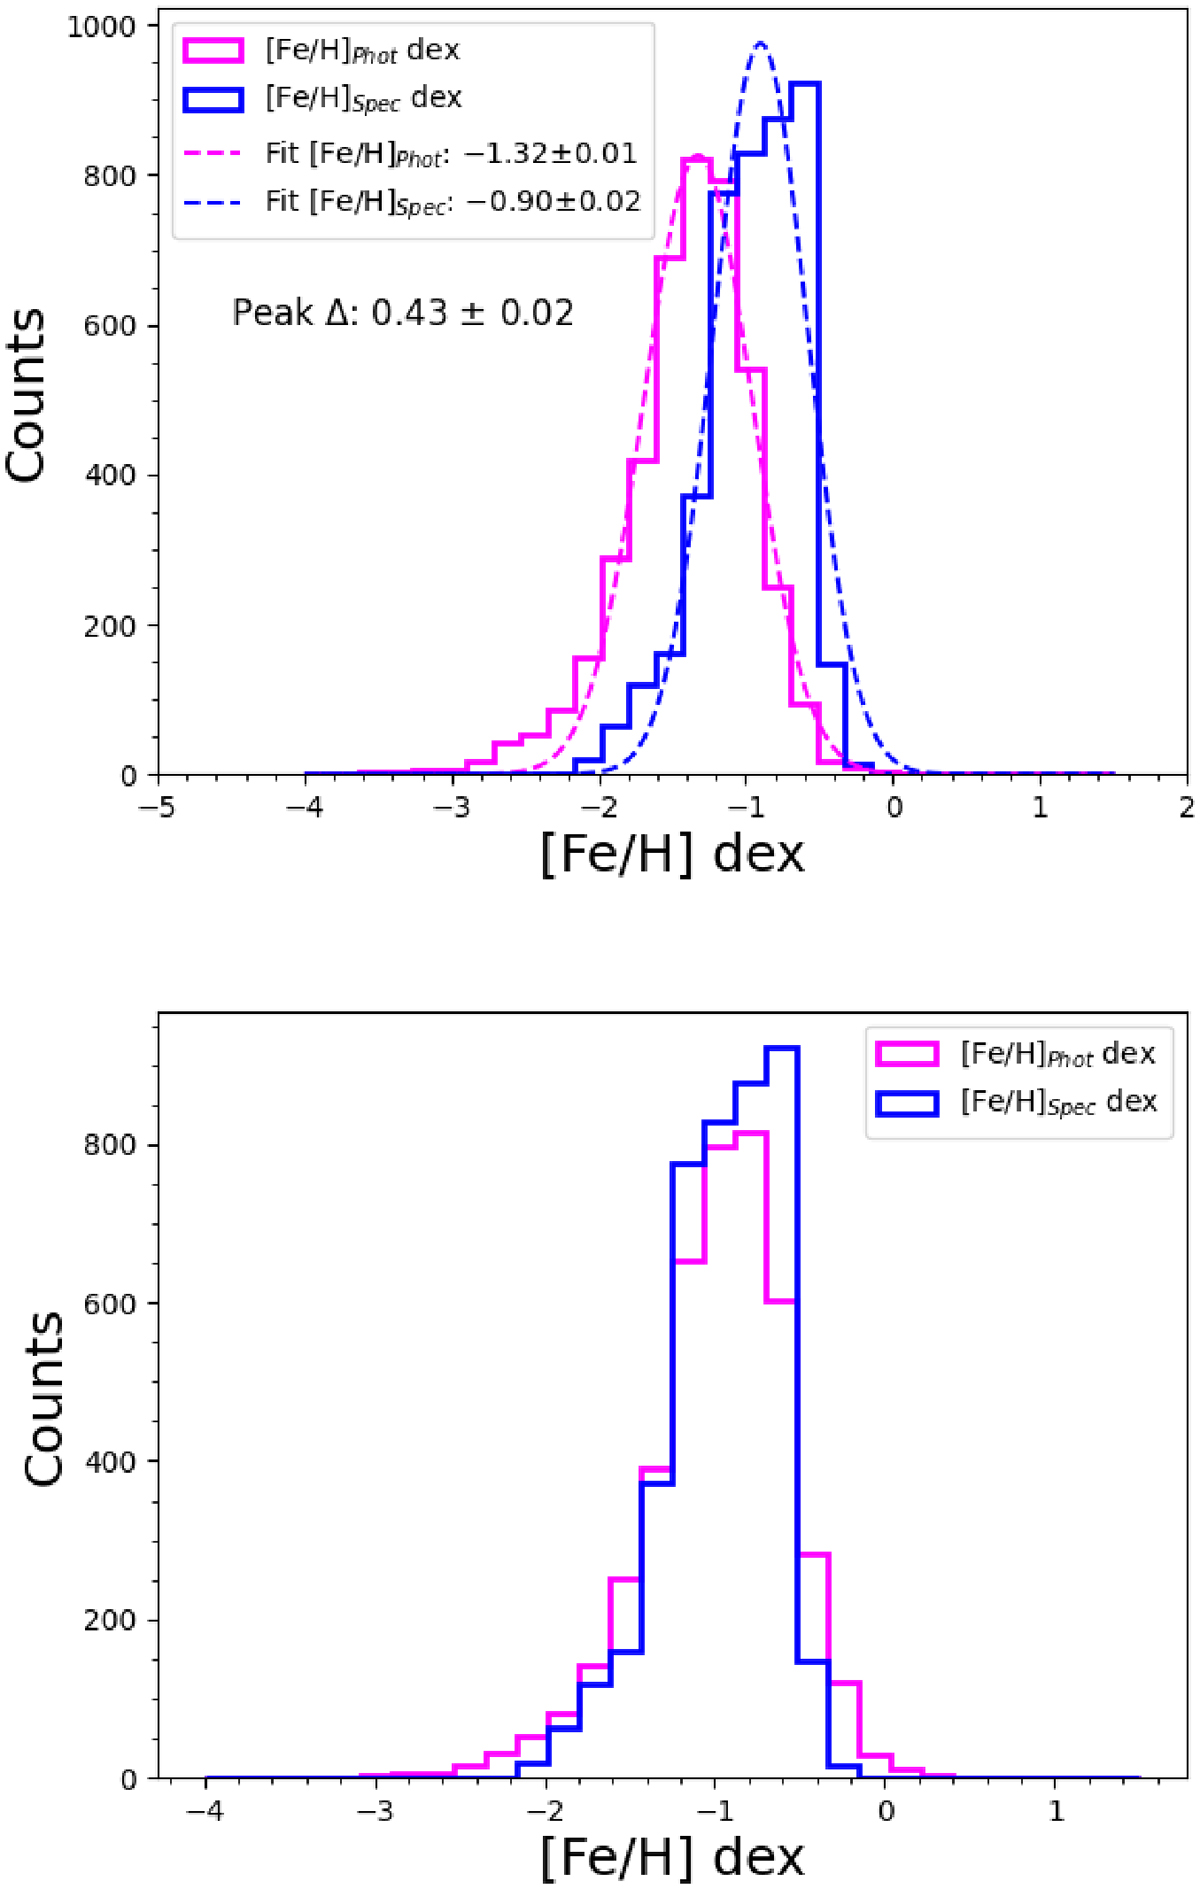
Histograms of the LMC and SMC sources used for recalibration. On the top panel, the estimated photometric (Phot; blue) metallicities are plotted together with the spectroscopic (Spec; pink) metallicities as measured. On the bottom panel photometric metallicities are exploited after the addition of systematic difference.
Current usage metrics show cumulative count of Article Views (full-text article views including HTML views, PDF and ePub downloads, according to the available data) and Abstracts Views on Vision4Press platform.
Data correspond to usage on the plateform after 2015. The current usage metrics is available 48-96 hours after online publication and is updated daily on week days.
Initial download of the metrics may take a while.