Fig. 12
Download original image
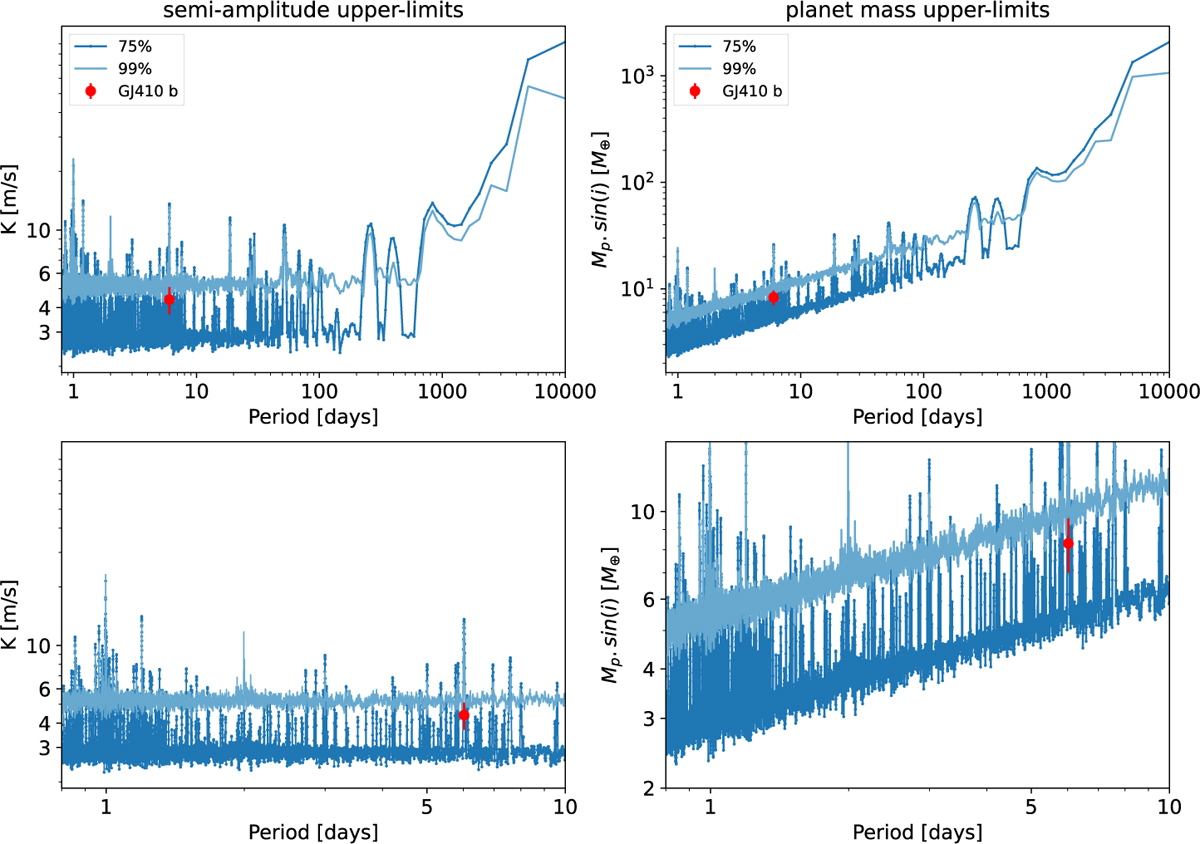
Detection limits in the SPIRou wPCA RV time series. The left panels show the upper limits on the semi-amplitude K in meters per second. The right panels display the limits in terms of the projected mass m sin(i). A zoom-in of the period range from 1 to 10 days is presented in the lower panels. Objects with a projected mass above the light blue and dark blue lines are ruled out with a confidence level of 99% and 75%, respectively. The red dot indicates the location of Gl 410b.
Current usage metrics show cumulative count of Article Views (full-text article views including HTML views, PDF and ePub downloads, according to the available data) and Abstracts Views on Vision4Press platform.
Data correspond to usage on the plateform after 2015. The current usage metrics is available 48-96 hours after online publication and is updated daily on week days.
Initial download of the metrics may take a while.