Fig. B.2
Download original image
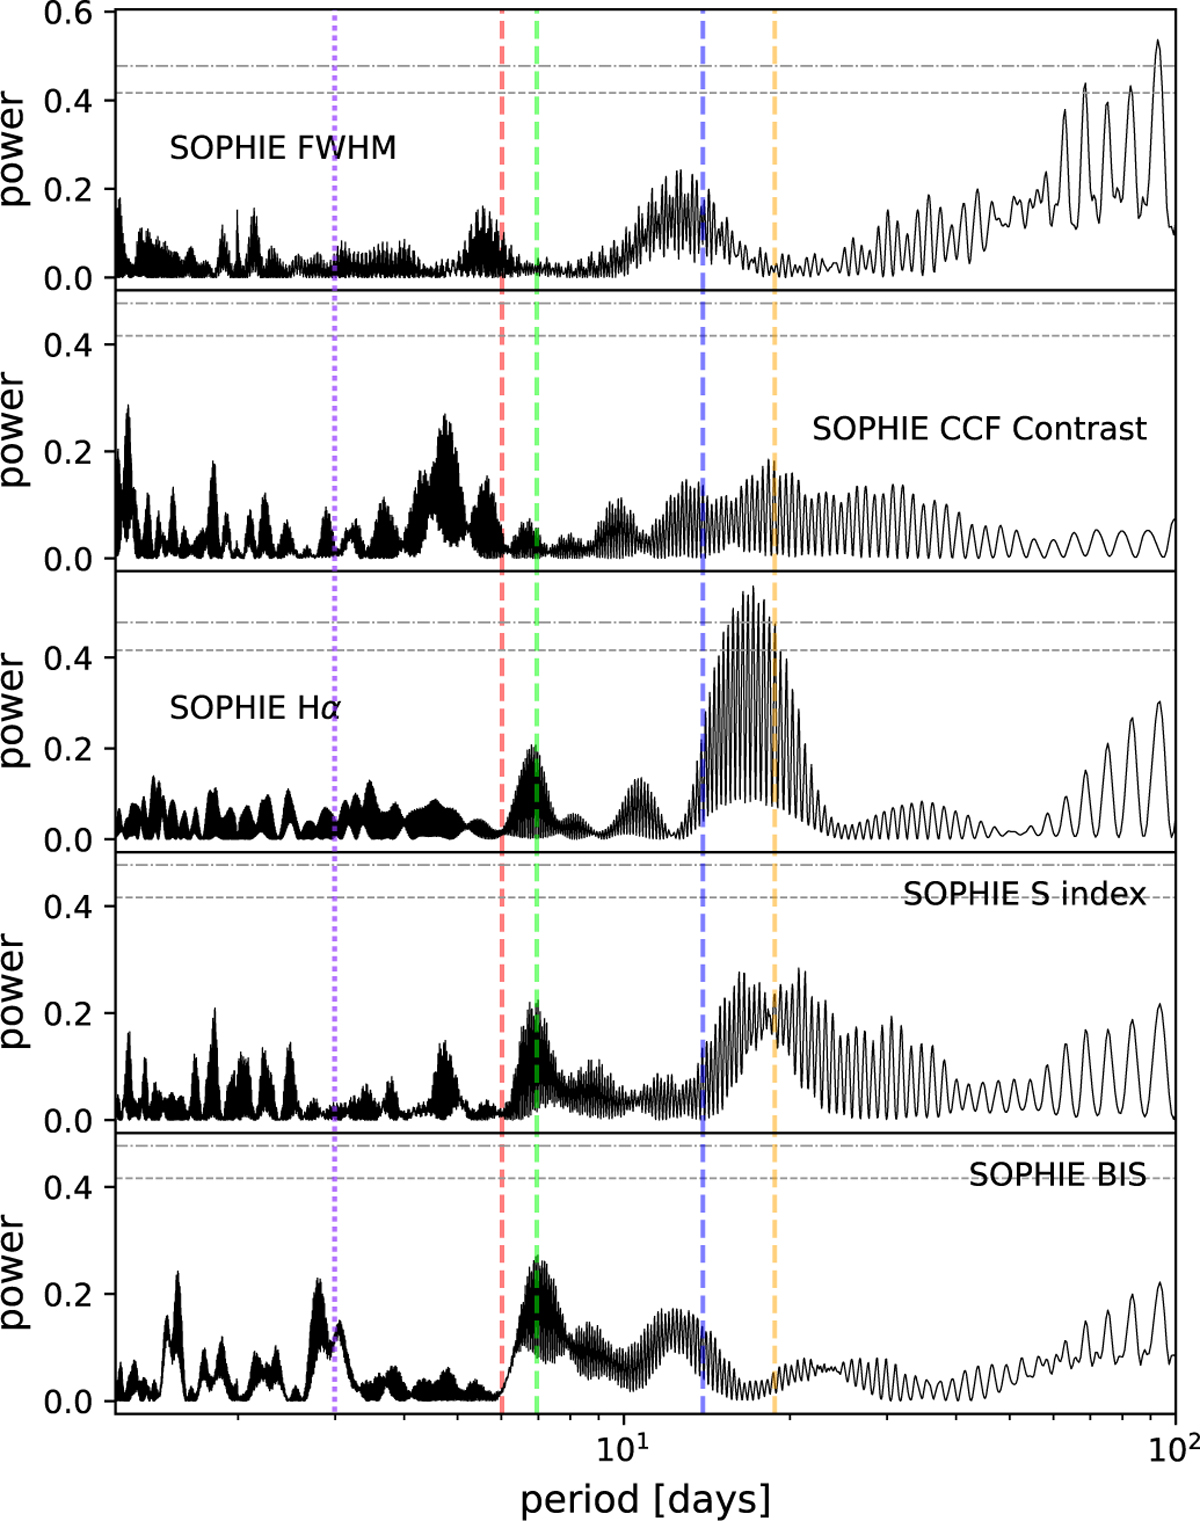
Periodograms of the SOPHIE activity indicators: FWHM, CCF contrast, Hα, S index, and BIS for the 2021–2023 period. The vertical dashed lines depict: in red, 6.02 days; in blue, the rotation period with its harmonic in green; in orange, 18.7 days, and, in purple dots, 2.99 days. The horizontal dashed lines indicate the 1% and 0.1% FAP levels.
Current usage metrics show cumulative count of Article Views (full-text article views including HTML views, PDF and ePub downloads, according to the available data) and Abstracts Views on Vision4Press platform.
Data correspond to usage on the plateform after 2015. The current usage metrics is available 48-96 hours after online publication and is updated daily on week days.
Initial download of the metrics may take a while.