Fig. 2
Download original image
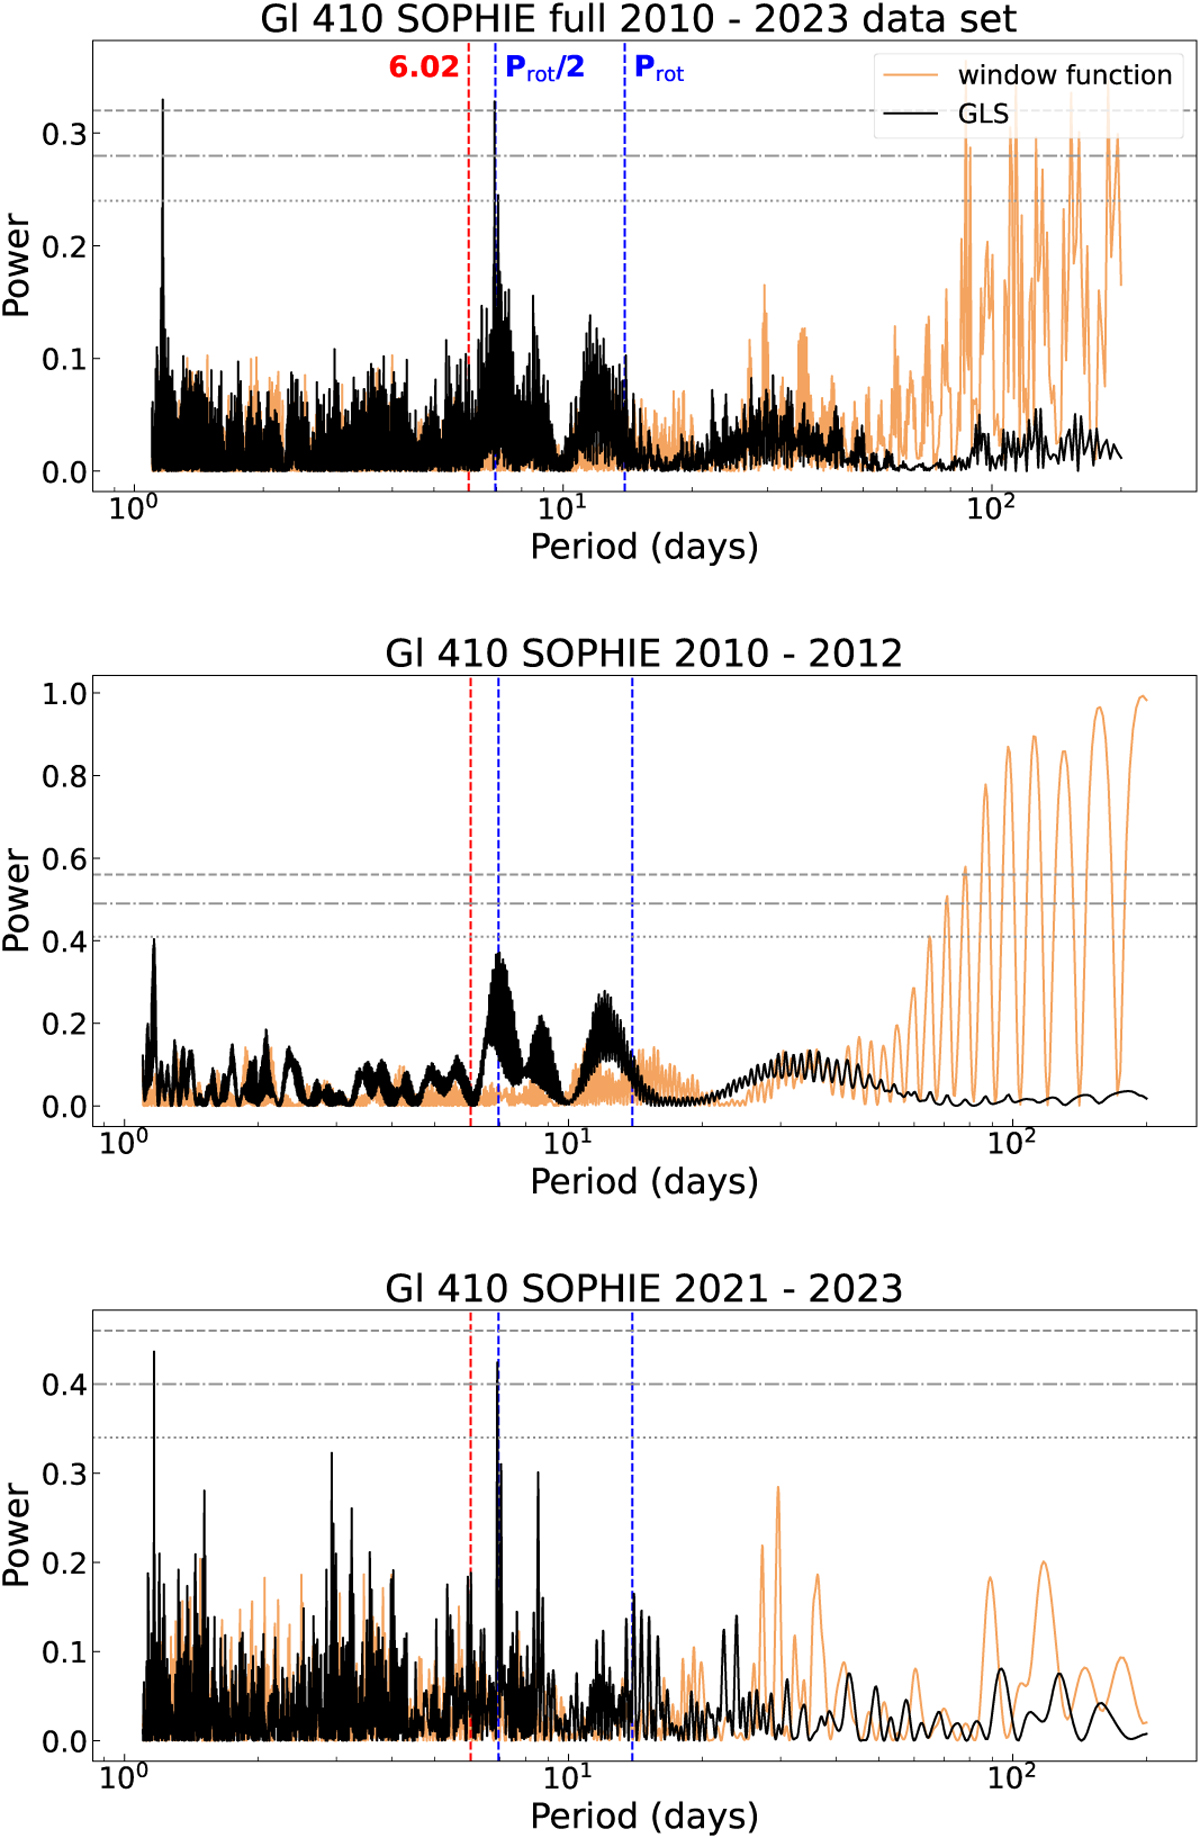
Generalized Lomb-Scargle Periodograms of the SOPHIE RV time series for the full 2010–2023 data set (top), the 2010–2012 period (middle), and the 2021–2023 period (bottom). The location of the rotational period of Prot = 13.9 days and its Prot/2 harmonic are indicated with blue vertical lines. The position of P = 6.02 days is displayed with a red vertical line. The horizontal lines indicate the bootstrap calculated at 0.1%, 1%, and 10% FAP levels. The window function is shown with a light orange color.
Current usage metrics show cumulative count of Article Views (full-text article views including HTML views, PDF and ePub downloads, according to the available data) and Abstracts Views on Vision4Press platform.
Data correspond to usage on the plateform after 2015. The current usage metrics is available 48-96 hours after online publication and is updated daily on week days.
Initial download of the metrics may take a while.