Fig. C.1
Download original image
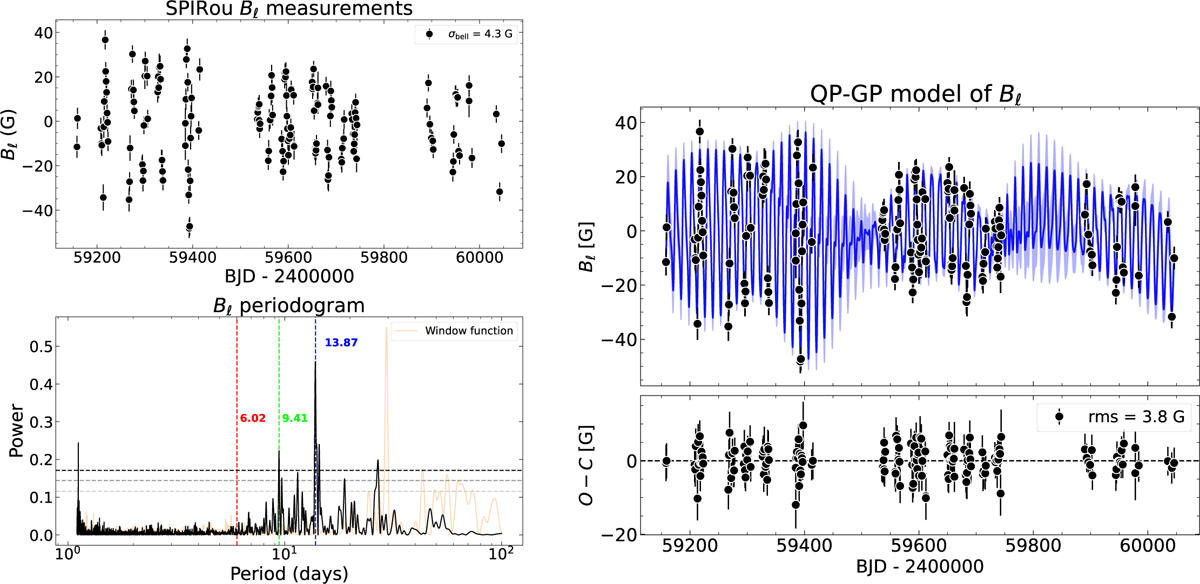
Left panel: SPIRou Bℓ measurements from Donati et al. (2023) and associated LS periodogram. The horizontal dashed lines represent the FAP levels of 0.1%, 1%, and 10% respectively. A significant peak at Ρ = 13.87 days (and lyr alias at 14.98 days) is clearly observed, which is associated with to 13.91 ± 0.09 day rotational period of the star Donati et al. (2023). An additional significant peak is seen at 9.41 days. No signals are seen at Ρ = 6.02 days. Right panel: quasi-periodic GP model fit (blue-line) of the SPIRou Bℓ time series (black dots). Details of the GP are given in Table C.1. The corner plot of the fit is given in Fig. D.1.
Current usage metrics show cumulative count of Article Views (full-text article views including HTML views, PDF and ePub downloads, according to the available data) and Abstracts Views on Vision4Press platform.
Data correspond to usage on the plateform after 2015. The current usage metrics is available 48-96 hours after online publication and is updated daily on week days.
Initial download of the metrics may take a while.