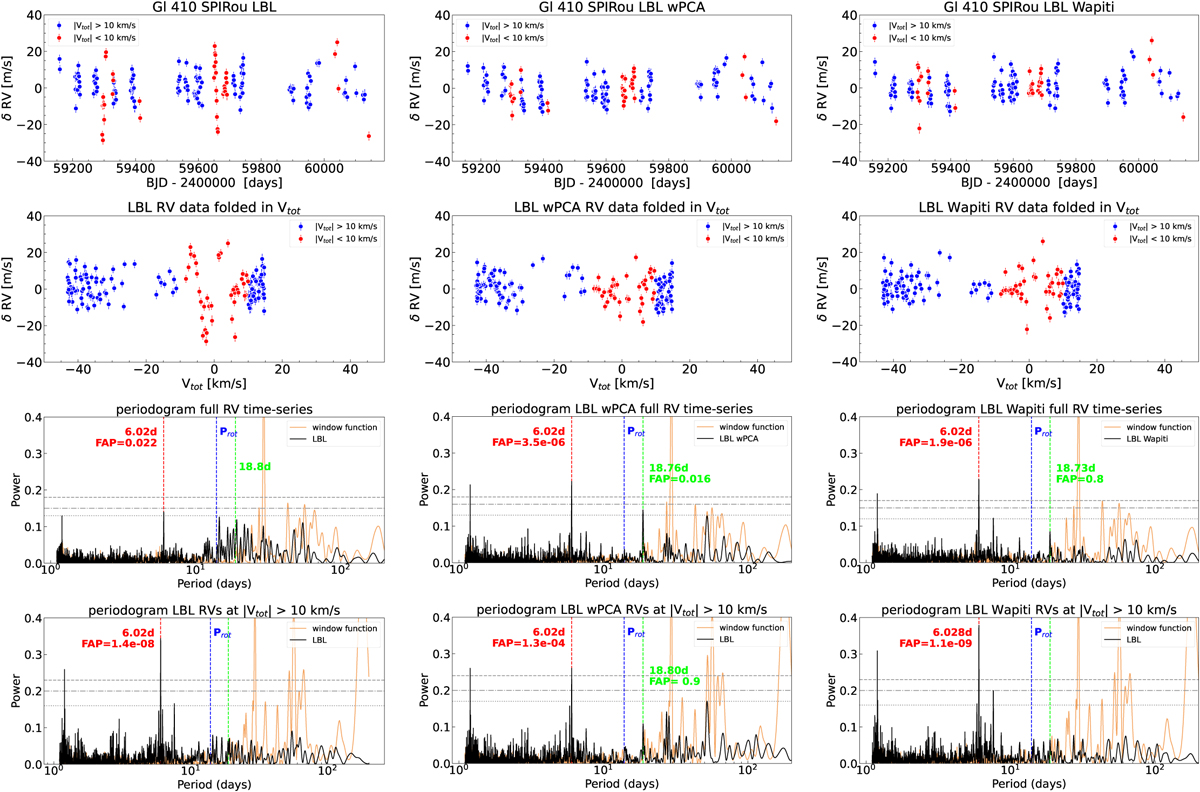
Fig. 3
Download original image
SPIRou RV measurements as a function of time and GLS periodograms for the “raw” LBL measurements and the PCA corrected LBL measurements obtained with wPCA (Artigau et al., in prep) and Wapiti (Ould-Elhkim et al. 2023). Blue dots indicate the measurements taken at |Vtot| > 10 km s–1. Red dots are the measurements obtained when |Vtot| < 10 km s–1 (i.e., moment of the highest influence of the atmosphere on the stellar spectrum). In the periodograms, the gray horizontal lines indicate the bootstrap-calculated 10%, 1%, and 0.1% FAP levels. A summary of the statistics of the each of the time series is provided in Table 6.
Current usage metrics show cumulative count of Article Views (full-text article views including HTML views, PDF and ePub downloads, according to the available data) and Abstracts Views on Vision4Press platform.
Data correspond to usage on the plateform after 2015. The current usage metrics is available 48-96 hours after online publication and is updated daily on week days.
Initial download of the metrics may take a while.