Open Access
Fig. G.2
Download original image
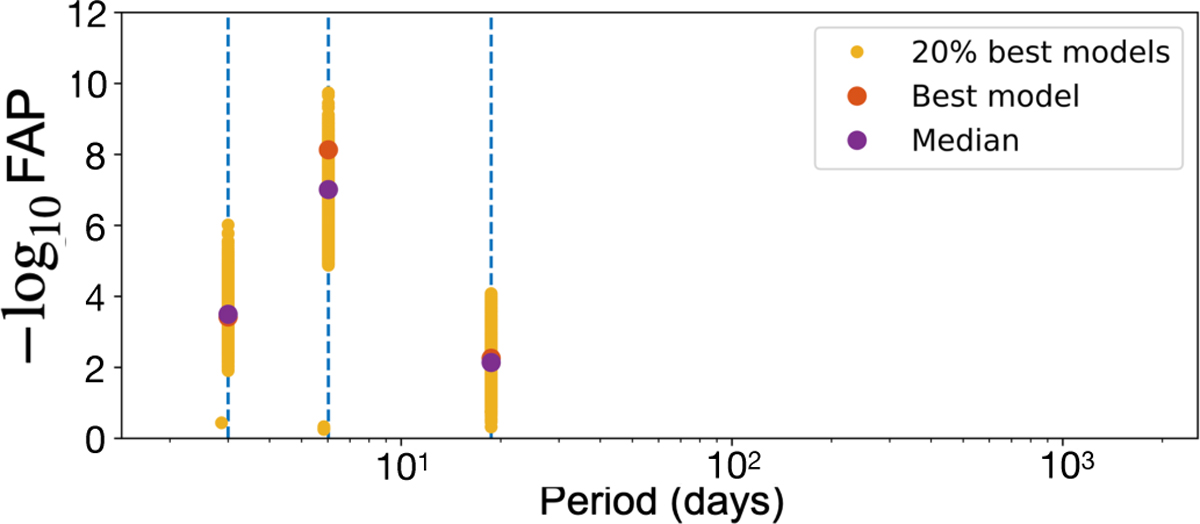
False alarm probability (FAP) of the signals appearing in the 20% of models with the highest Bayesian evidence (Laplace approximation). Each yellow point represents the FAP of a signal included in the model. Purple points represent the median values of the FAPS, and the red ones indicate the FAP of the highest ranked model.
Current usage metrics show cumulative count of Article Views (full-text article views including HTML views, PDF and ePub downloads, according to the available data) and Abstracts Views on Vision4Press platform.
Data correspond to usage on the plateform after 2015. The current usage metrics is available 48-96 hours after online publication and is updated daily on week days.
Initial download of the metrics may take a while.