Open Access
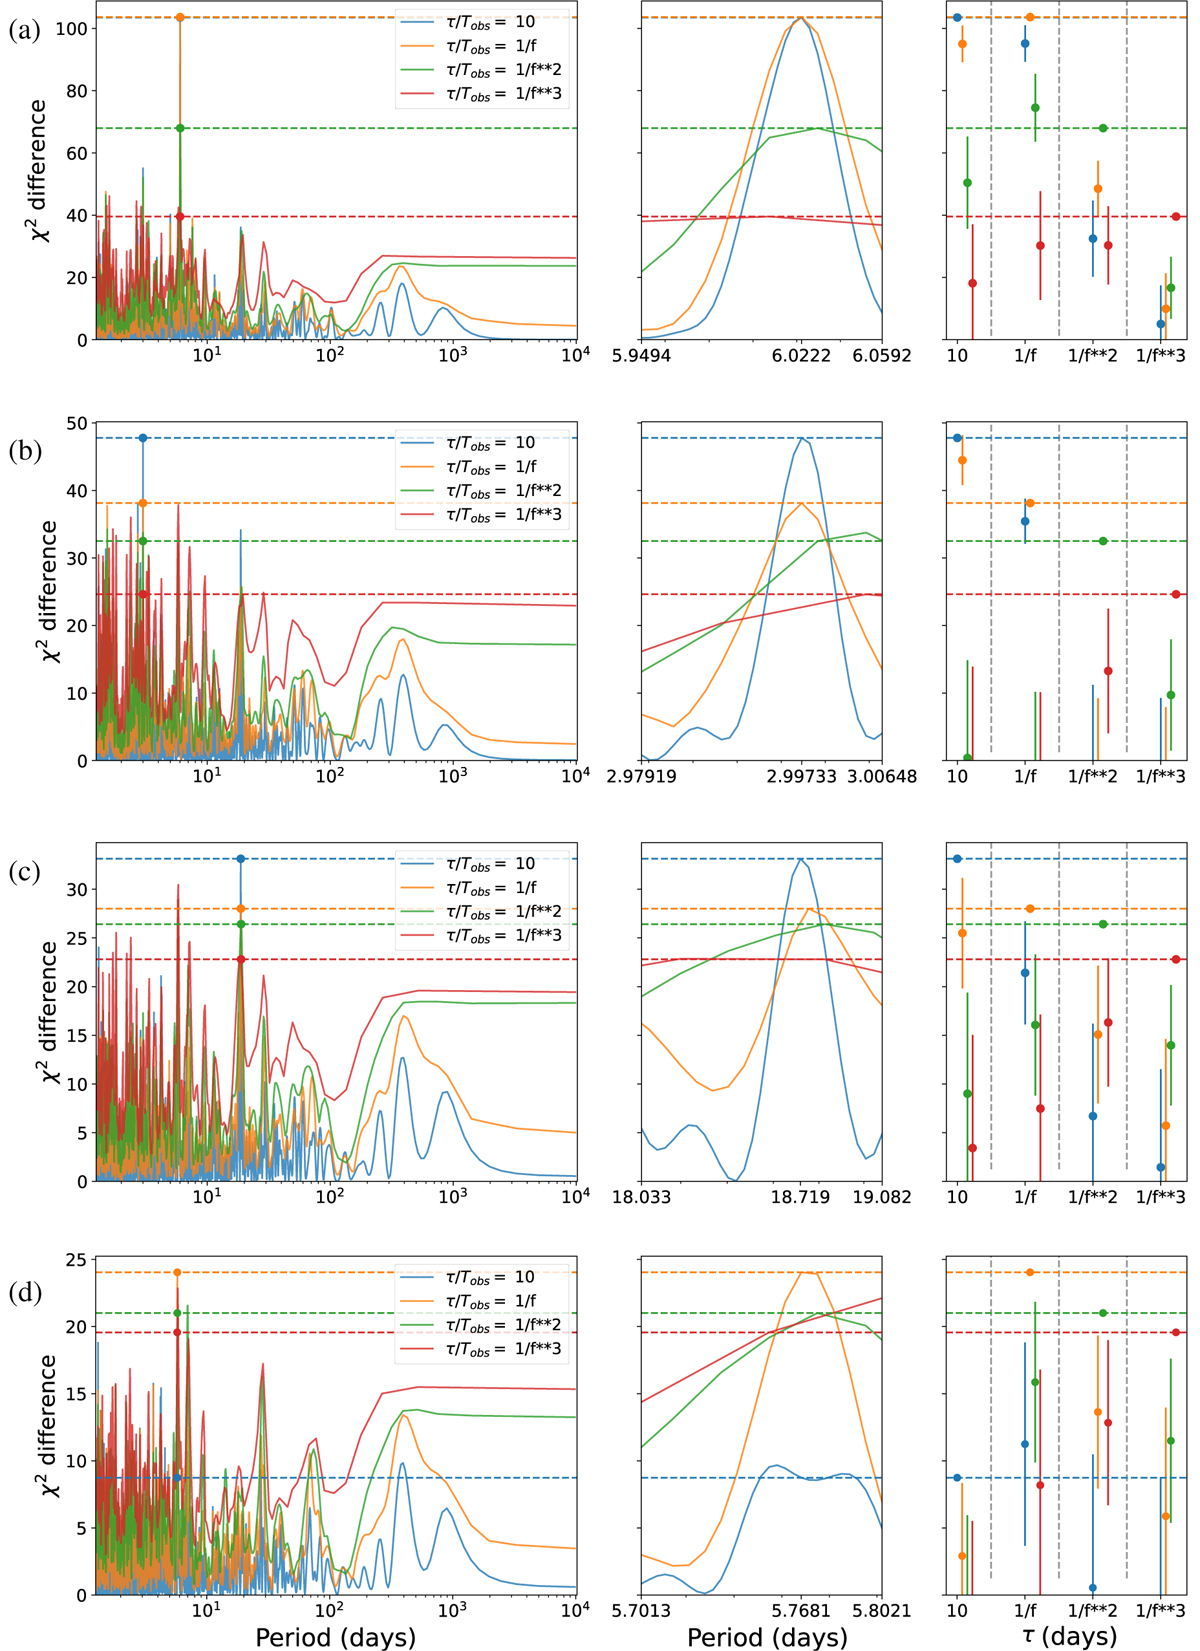
Fig. G.4
Download original image
Four first iterations of the ASPs method. Models correspond to the maximum of the ASPs. The left panels represent the periodograms. the middle panels a zoom in on the highest peak, and the right hand panel represents a statistical significance test (see text for details).
Current usage metrics show cumulative count of Article Views (full-text article views including HTML views, PDF and ePub downloads, according to the available data) and Abstracts Views on Vision4Press platform.
Data correspond to usage on the plateform after 2015. The current usage metrics is available 48-96 hours after online publication and is updated daily on week days.
Initial download of the metrics may take a while.